モチベーション
データを分析していると、たまに以下のような状況に遭遇します。
- 種類の多いデータの関係性を知りたい
- 割とノイズが激しいけど、他のデータと比較したい
- 見せかけの相関は除外したい
- 本当に関係があるものは僅かしかない、という前提をおきたい
- とりあえず何かしらの手法を試したい
こんな時はとりあえず Graphical lasso を使ってみよう、というお話です。
Graphical lasso とは
ざっくりいえば、変数間の関係をグラフ化する手法です。
多変量ガウス分布を前提とした手法ですので、結構色々なところで使える気がします。
詳しくはこの本が非常にわかりやすく解説してくれます。理論に興味がある方は是非お手に。
実装
今回実装したものは、推定された精度行列を相関行列に変換して、グラフで出力するプログラムになります。
まだまだ改良の余地はありますが、データ分析を進める上での一つの指標にはなると思います。
# テストデータを用意する。
from sklearn.datasets import load_boston
boston = load_boston()
X = boston.data
feature_names = boston.feature_names
import pandas as pd
import numpy as np
import scipy as sp
from sklearn.covariance import GraphicalLassoCV
import igraph as ig

# 同じ特徴量の中で標準化する。
X = sp.stats.zscore(X, axis=0)

# GraphicalLassoCV を実行する。
model = GraphicalLassoCV(alphas=4, cv=5)
model.fit(X)

# グラフデータ生成する。
grahp_data = glasso_graph_make(model, feature_names, threshold=0.2)

# グラフを表示する。
grahp_data
def glasso_graph_make(model, feature_names, threshold):
    # 分散共分散行列を取得する。
    # -> 参考URL:https://scikit-learn.org/stable/modules/generated/sklearn.covariance.GraphicalLassoCV.html
    covariance_matrix = model.covariance_

    # 分散共分散行列を相関行列に変換する。
    diagonal = np.sqrt(covariance_matrix.diagonal())
    correlation_matrix = ((covariance_matrix.T / diagonal).T) / diagonal

    # グラフ表示のために対角成分が0の行列を生成する。
    correlation_matrix_diag_zero = correlation_matrix - np.diag( np.diag(correlation_matrix) )
    df_grahp_data = pd.DataFrame( index=feature_names, columns=feature_names, data=correlation_matrix_diag_zero.tolist() )

    # グラフ生成準備
    grahp_data = ig.Graph()
    grahp_data.add_vertices(len(feature_names))
    grahp_data.vs["feature_names"] = feature_names
    grahp_data.vs["label"] = grahp_data.vs["feature_names"]
    visual_style = {}
    edge_width_list = []
    edge_color_list = []

    # グラフ生成
    for target_index in range(len(df_grahp_data.index)):
        for target_column in range(len(df_grahp_data.columns)):
            if target_column >= target_index:
                grahp_data_abs_element = df_grahp_data.iloc[target_index, target_column]
                if abs(grahp_data_abs_element) >= threshold:
                    edge = [(target_index, target_column)]
                    grahp_data.add_edges(edge)
                    edge_width_list.append(abs(grahp_data_abs_element)*10)
                    if grahp_data_abs_element > 0:
                        edge_color_list.append("red")
                    else:
                        edge_color_list.append("blue")

    visual_style["edge_width"] = edge_width_list
    visual_style["edge_color"] = edge_color_list

    return ig.plot(grahp_data, **visual_style, vertex_size=50, bbox=(500, 500), vertex_color="skyblue", layout = "circle", margin = 50)
結果
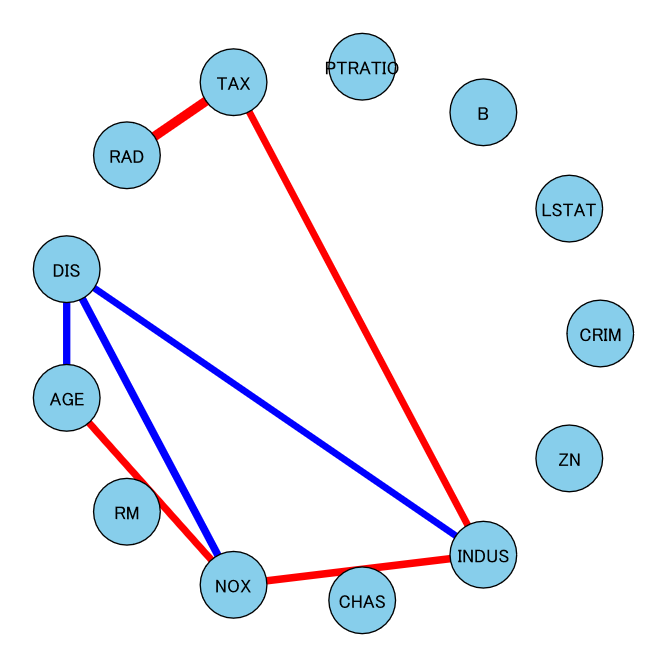
しきい値をかなり低めに設定しているせいか、直接相関がそれなりに見つかっていますね。
試しに相関が一番強そうな変数同士を見てみます。
相関係数が最も高いのは、RAD(高速道路へのアクセスしやすさ)とTAX($10,000あたりの不動産税率の総計)です。すなわち、高速道路にアクセスしやすいと税金が高いということですね。
正直、このデータだけではなんとも言えないのですが、まるで見当違いな結果でもなさそうです。
最後に
とりあえず試せる環境は最高ですね。
結果については、もう少しデータ数が多く、ノイジーなデータであった方がわかりやすかったかもしれません。どこかにないですかね。
今回は Graphical lasso を用いて変数間の関係性をグラフ化するところまで行いましたが、その先にはグラフ構造に着目した変化検知手法などもあり、まだまだ勉強のし甲斐がある分野だと感じています。
注意および免責事項
本記事の内容はあくまで私個人の見解であり、所属する組織の公式見解ではありません。
本記事の内容を実施し、利用者および第三者にトラブルが発生しても、筆者および所属組織は一切の責任を負いかねます。
