どうもmiyachi(@_38ch)です。
以前の記事でご紹介した地図ライブラリ「Leaflet」にCluster機能を追加する方法を書いていきます。
Cluster機能ってどんなの?
いわゆるこういうやつです。地図上のピンが多くなってきたときに、ズームアウトすると、距離の近いピン同士が一つのグループに固まってくれる機能です。Clusterには、そこに何個のピンが含まれているかが数字で表示されます。
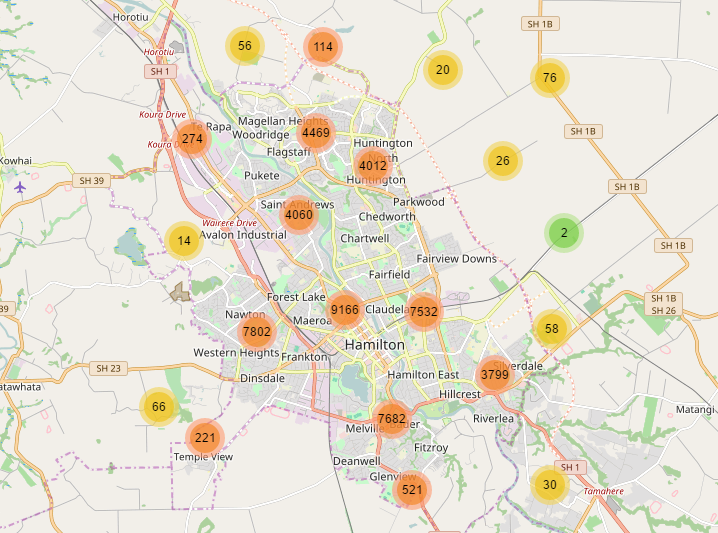
このClusterをクリックすると、そのClusterにズームインして、詳細を確認することができます。
実装方法
Leaflet.markerclusterを使います。
基本的な地図の表示方法は僕の以前の記事「地図ライブラリの本命「Leaflet」を5分で理解&導入する」をご覧ください。
まずは、JSとCSSの読み込み。
<script src="https://unpkg.com/leaflet.markercluster@1.3.0/dist/leaflet.markercluster.js"></script>
<link rel="stylesheet" href="https://unpkg.com/leaflet.markercluster@1.3.0/dist/MarkerCluster.css" />
<link rel="stylesheet" href="https://unpkg.com/leaflet.markercluster@1.3.0/dist/MarkerCluster.Default.css" />
下記では、ランダムに30個のピンを地図上に追加しています。
var markers = L.markerClusterGroup();
for (var i = 0; i < 30; i++) {
    var marker = L.marker([51.5 + (Math.random() / 10), -0.09 + (Math.random() / 10)]);
    marker.bindPopup("<b>Hello</b>");
    markers.addLayer(marker);
}
mymap.addLayer(markers);
ブラウザで表示するとこのような感じになります。
ズームアウト
ズームイン
どうでしょうか?いい感じのアニメーションでClusterが機能しています。
ソースコードの全容は以下です。
<!DOCTYPE html>
<html>
<head>
<meta charset="utf-8">
<link rel="stylesheet" href="https://unpkg.com/leaflet@1.3.1/dist/leaflet.css" integrity="sha512-Rksm5RenBEKSKFjgI3a41vrjkw4EVPlJ3+OiI65vTjIdo9brlAacEuKOiQ5OFh7cOI1bkDwLqdLw3Zg0cRJAAQ==" crossorigin="" />
<script src="https://unpkg.com/leaflet@1.3.1/dist/leaflet.js" integrity="sha512-/Nsx9X4HebavoBvEBuyp3I7od5tA0UzAxs+j83KgC8PU0kgB4XiK4Lfe4y4cgBtaRJQEIFCW+oC506aPT2L1zw==" crossorigin=""></script>
<script src="https://unpkg.com/leaflet.markercluster@1.3.0/dist/leaflet.markercluster.js"></script>
<link rel="stylesheet" href="https://unpkg.com/leaflet.markercluster@1.3.0/dist/MarkerCluster.css" />
<link rel="stylesheet" href="https://unpkg.com/leaflet.markercluster@1.3.0/dist/MarkerCluster.Default.css" />
<title>Leaflet</title>
</head>
<body>
<div id="mapid"></div>
</body>
</html>
<style media="screen">
#mapid {
height: 800px;
width: 100%;
}
</style>
<script type="text/javascript">
var mymap = L.map('mapid').setView([51.505, -0.09], 12);
L.tileLayer('https://api.tiles.mapbox.com/v4/{id}/{z}/{x}/{y}.png?access_token={accessToken}', {
attribution: 'Map data © <a href="http://openstreetmap.org">OpenStreetMap</a> contributors, <a href="http://creativecommons.org/licenses/by-sa/2.0/">CC-BY-SA</a>, Imagery © <a href="http://mapbox.com">Mapbox</a>',
maxZoom: 18,
id: 'mapbox.streets',
accessToken: 'xxxxxxxxxxxxxxxxxxxxxxxxxxxxxxxxx'
}).addTo(mymap);
var markers = L.markerClusterGroup();
for (var i = 0; i < 30; i++) {
var marker = L.marker([51.5 + (Math.random() / 10), -0.09 + (Math.random() / 10)]);
marker.bindPopup("<b>Hello</b>");
markers.addLayer(marker);
}
mymap.addLayer(markers);
</script>