はじめに
少し前にKaggleで見かけたTensorFlow Decision ForestsなるTensorFlowライブラリが気になったので、ちょっと調べて使ってみました。記事書いてる人も少なそうだったので、投稿してみます。
実行環境
どうやらまだWindows、Macは未対応みたいなので、ここではgoogle Colab を使用します。データセットは私の過去の記事でも使っているscikit-learnデータセットの乳がん患者を使用したいと思います。
インストール
TensorFlow Decision Forestsのインストール
!pip install tensorflow_decision_forests
インポート
使用するライブラリはnumpy, pandas, データセットに scikit-learn, そして TensorFlow Decision Forestsです。
import numpy as np
import pandas as pd
from sklearn.datasets import load_breast_cancer
import tensorflow_decision_forests as tfdf
データセットの読み込み
使用するデータセットはscikit-learnデータセットの乳がん患者データセットを使います。
cancer = load_breast_cancer()
cancer_data = pd.DataFrame(cancer.data, columns = cancer.feature_names).assign(malignant=np.array(cancer.target))
訓練用データセットとテスト用データセットへの分割
8:2で訓練用データセットとテスト用データセットに分割
def split_dataset(dataset, test_ratio=0.2):
    test_indices = np.random.rand(len(dataset)) < test_ratio
    return dataset[~test_indices], dataset[test_indices]

train_ds_pd, test_ds_pd = split_dataset(cancer_data)
データセットをtensorflow用のデータセットに変換
このときに従属変数をlabelで指定します。
train_ds = tfdf.keras.pd_dataframe_to_tf_dataset(train_ds_pd, label='malignant')
test_ds = tfdf.keras.pd_dataframe_to_tf_dataset(test_ds_pd, label='malignant')
モデルの訓練
後で見れるようにcompileでmetricsにaccuracyを指定しておきます。
model = tfdf.keras.RandomForestModel()
model.compile(metrics=["accuracy"])
model.fit(train_ds)
モデルのサマリーを確認
出力は省略しますが、summaryでモデルの概要、独立変数の重要度、訓練時のログなどが確認できます。
model.summary()
テスト用データセットを使っての推論
accuracy:1.0となかなかの好結果が出ました。
model.evaluate(test_ds)
1/1 [==============================] - 1s 1s/step - loss: 0.0000e+00 - accuracy: 1.0000
[0.0, 1.0]
その他
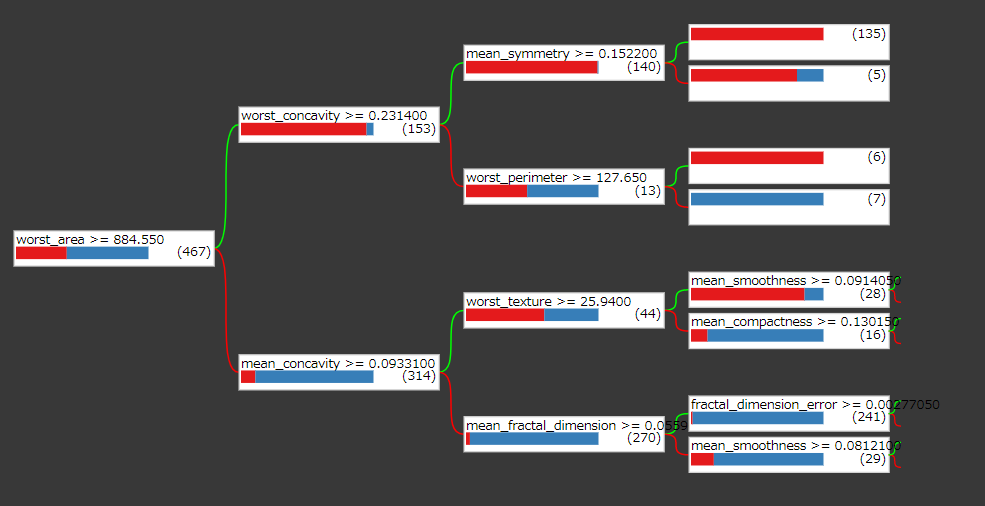
決定木の出力
tfdf.model_plotter.plot_model_in_colab(model)
出力
訓練ログのプロット
import matplotlib.pyplot as plt

logs = model.make_inspector().training_logs()

plt.figure(figsize=(12, 4))

plt.subplot(1, 2, 1)
plt.plot([log.num_trees for log in logs], [log.evaluation.accuracy for log in logs])
plt.xlabel("Number of trees")
plt.ylabel("Accuracy (out-of-bag)")

plt.subplot(1, 2, 2)
plt.plot([log.num_trees for log in logs], [log.evaluation.loss for log in logs])
plt.xlabel("Number of trees")
plt.ylabel("Logloss (out-of-bag)")

plt.show()
出力

おわりに
使い勝手としてはscikit-learnと同じようにお手軽に使える感じで、決定木の中身や学習ログが簡単に見れるのはTensorFlowっぽいですね。モデルはランダムフォレスト以外にも交配ブースティングなども使えるようです。