はじめに
Plotly.js は d3.js をベースとしたグラフ用 JavaScript ライブラリです。
お手軽にきれいなグラフが作れます。
準備するもの
JavaScript ライブラリをダウンロードします。
以下のページの「Download plotly.js」をクリックするとライブラリのダウンロードが開始します。
「plotly-latest.min.js」という名前でファイルがダウンロードできたら、
あとは、HTMLに記述するだけ。
<head>
	<script src="plotly-latest.min.js"></script>
</head>
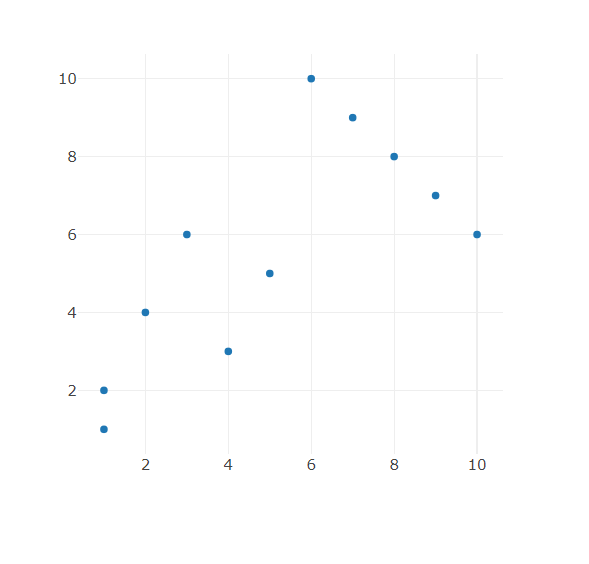
scatter (散布図) を表示する
<!DOCTYPE html PUBLIC "-//W3C//DTD HTML 4.01 Transitional//EN" "http://www.w3.org/TR/html4/loose.dtd">
<html lang="ja">
<head>
<meta http-equiv="Content-Type" content="text/html; charset=utf-8">
<meta http-equiv="Content-Script-Type" content="text/javascript">
<meta http-equiv="Content-Style-Type" content="text/css">
<meta http-equiv="Pragma" content="no-cache">
<meta charset="utf-8">
<script type="text/javascript" src="plotly-latest.min.js" charset="utf-8"></script>

<title>scatter test</title>
</head>

<body>

<div id="scatter"></div>

<script language="JavaScript" type="text/javascript">

<!--
var xValues = [1,2,3,4,5,6,7,8,9,10,1];
var yValues = [2,4,6,3,5,10,9,8,7,6,1];
var textValues = ["A","B","C","D","E","F","G","H","I","J","K"];
var data = [
{
	x:xValues,
	y:yValues,
	text:textValues,
	hoverinfo:'text+x+y',
	type:'scatter',
	mode:'markers',
}
	];

var layout = {
	hovermode:'closest',
	autosize: false, width:500, height:500
}	;

Plotly.newPlot('scatter', data, layout, {displayModeBar: false});
//-->

</script>

</body>
</html>
div タグで指定した場所にグラフがレンダリングされます。
(Plotly.newPlot() を呼び出す際に、div タグに指定したID を渡す。)
グラフの種類は、type で決まります。
散布図の場合は、 type:'scatter' と書けばOK。
scatter (散布図) カスタマイズ その1
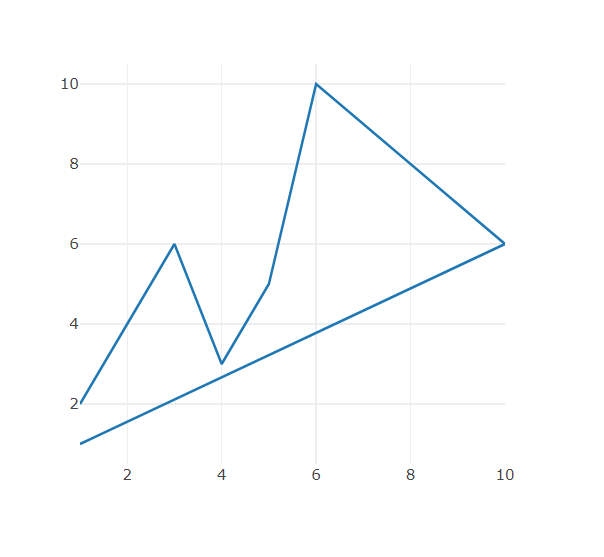
mode:'markers' とすると点ですが、 mode:'lines' とすれば 線になります。
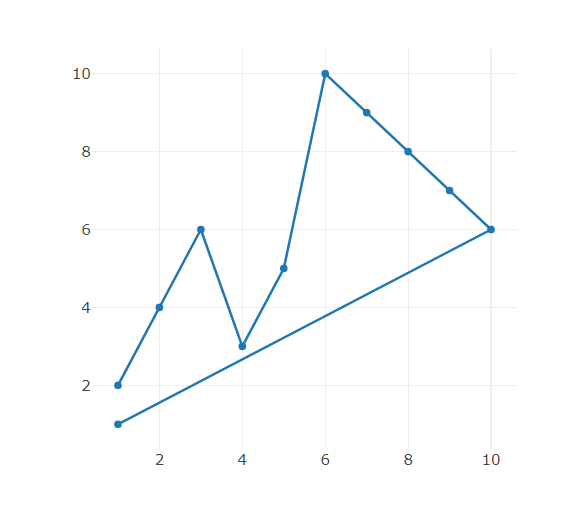
重ね技もできて、 mode:'markers+lines' とすれば点と線で表示となります。
scatter (散布図) カスタマイズ その2
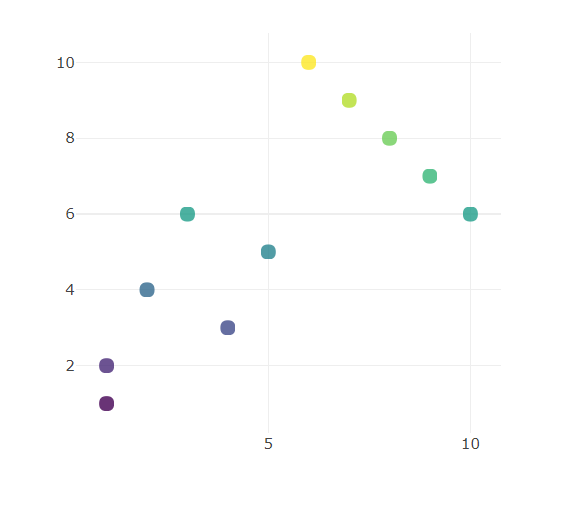
marker の色を変えてみます。
colorscale を利用してイイ感じに色を変えます。
color に rgb で指定してもいいのですが、colorscale だと色のバリエーションを考えなくてもよいので
おすすめです。
https://plot.ly/javascript/colorscales/
colorscale自体をカスタマイズすることもできます。
ヒートマップのグラフ作成時に試したので、その記事に載せます。
なお、以下の例では、markerのサイズと透明度も指定しています。
<!DOCTYPE html PUBLIC "-//W3C//DTD HTML 4.01 Transitional//EN" "http://www.w3.org/TR/html4/loose.dtd">
<html lang="ja">
<head>
<meta http-equiv="Content-Type" content="text/html; charset=utf-8">
<meta http-equiv="Content-Script-Type" content="text/javascript">
<meta http-equiv="Content-Style-Type" content="text/css">
<meta http-equiv="Pragma" content="no-cache">
<meta charset="utf-8">
<script type="text/javascript" src="plotly-latest.min.js" charset="utf-8"></script>

<title>scatter test</title>
</head>

<body>

<div id="scatter"></div>

<script language="JavaScript" type="text/javascript">

<!--
var xValues = [1,2,3,4,5,6,7,8,9,10,1];
var yValues = [2,4,6,3,5,10,9,8,7,6,1];
var textValues = ["A","B","C","D","E","F","G","H","I","J","K"];
var data = [
{
	x:xValues,
	y:yValues,
	text:textValues,
	hoverinfo:'text+x+y',
	type:'scatter',
	mode:'markers',
	marker:{
		colorscale:'Viridis',
		color : yValues,
		opacity:0.8,
		size:12
	}
}
	];

var layout = {
	hovermode:'closest',
	autosize: false, width:500, height:500
}	;

Plotly.newPlot('scatter', data, layout, {displayModeBar: false});
//-->

</script>

</body>
</html>
colorscale :'Viridis' の例
おわりに
Plotly を利用した Python の例は数あれど、JavaScript の例が少ないので書いてみました。
グラフは X, Y 軸にどのようなデータを使うかが重要ですが、Plotly を使えば試行錯誤が簡単です。
様々なパターンでグラフ表示してみて、訴求力のあるものをつくりたいですね。


