reactleafletとは
reactのライブラリで完全無料で地図データを扱うことができます。
今回作成したアプリ
技育博というハッカソンで実際に作ったアプリが「バズっている場所を表す」という趣旨でした。地図の機能として地図上にバズっている場所を表示、ズームしていくにつれバズ度が低い場所も表示する、数字もhtml,cssと共に表示するというものでした。
地図の種類
react leafletは単なるライブラリなので地図の種類はこちらで設定することができます。
地図の種類例
現在地マーカーの表示方法
公式のコピペです。とりあえず固定値で。
const position = [51.505, -0.09]
return(
<MapContainer center={position} zoom={13} scrollWheelZoom={false}>
<TileLayer
attribution='© <a href="https://www.openstreetmap.org/copyright">OpenStreetMap</a> contributors'
url="https://{s}.tile.openstreetmap.org/{z}/{x}/{y}.png"
/>
<Marker position={position}>
</Marker>
</MapContainer>
)
Markerタグはnode_modules/leaflet/dist/imagesに入っているマーカーアイコンです。このアイコン、開発環境では表示されるのですがデプロイした後は表示されなくなりました。なので変更する必要があります。
const customMarker = () => {

    return L.icon({
      iconUrl: "/img/blue.svg",
      iconSize: [35, 35],
      className: "marker",
    });
  };

<Marker position={arrCenter} icon={customMarker()}/>
javascriptで現在地の取得ができます。
type CurrentPosition = {
  latitude: number;
  longitude: number;
};

  const [correntposition, setCorrentPosition] = useState<CurrentPosition>({
    latitude: 35.6586205576023,
    longitude: 139.74543043734087,
  });

  //現在地の取得
  useEffect(() => {
    navigator.geolocation.getCurrentPosition((position) => {
      const { latitude, longitude } = position.coords;
      setCorrentPosition({ latitude, longitude });
    });
  }, []);
これをさっきのpositionに代入します。
const position = [correntposition.latitude, correntposition.longitude]
return(
<MapContainer center={position} zoom={13} scrollWheelZoom={false}>
<TileLayer
attribution='© <a href="https://www.openstreetmap.org/copyright">OpenStreetMap</a> contributors'
url="https://{s}.tile.openstreetmap.org/{z}/{x}/{y}.png"
/>
<Marker position={position}>
</Marker>
</MapContainer>
)
ピンを置く方法
このarrDistanceごとにピンを置きたい。
arrDistance = [
  {
    latutude:35.7001517 //緯度
    likes:"892.5k" //バズ度(tiktokで押されたバズ度)
    longitude:139.7007061 //経度
    place:"東京都新宿区新大久保"  //場所名
  },{
    latutude:35.7194294
    likes:"525.4k"
    longitude:139.7952466
    place:"浅草にある老舗喫茶店「しゃん」"
  }
]
function SetViewOnClick() {
const map = useMapEvent("click", (e) => {
map.setView(e.latlng, map.getZoom(), {
animate: true,
});
});
return null;
}
<MapContainer center={position} zoom={13} scrollWheelZoom={false}>
<TileLayer
attribution='© <a href="https://www.openstreetmap.org/copyright">OpenStreetMap</a> contributors'
url="https://{s}.tile.openstreetmap.org/{z}/{x}/{y}.png"
/>
<SetViewOnClick />
<Marker position={position}>
<PinLocate
arrDistance={arrDistance}
correntposition={correntposition}
/>
</Marker>
</MapContainer>
SetViewOnClickでmap上をタップした時にそこに動くようになります。
function PinLocate({ arrDistance }: PinLocateProps) {


  const uniqueArrDistance = Array.from(new Map(arrDistance.map((distance) => [distance.latitude, distance])).values());

   return (
    <div>
    {uniqueArrDistance.map((place, index) => (
        <Marker
          position={[place.latitude, place.longitude]}
          key={index}
        />
    ))}
    </div>
  );
}
uniqueArrDistanceでユニークな値にします。これでarrDistanceの値ごとで地図上にマーカーを置くことができます。
ピン周りに文字を入力する
ピンにarrDistanceのlikes、バズ度を表示させます。
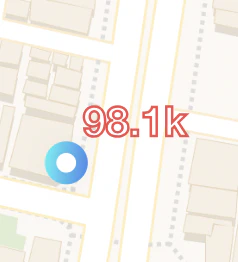
before
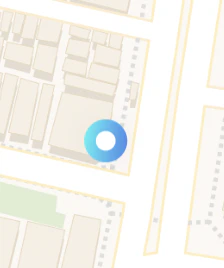
after
function PinLocate({ arrDistance }: PinLocateProps) {

import blueicon from "../../public/img/blueIcon.svg";
import fireicon from "../../public/img/fireIcon.svg";
import greenicon from "../../public/img/greenIcon.svg";
import redIcon from "../../public/img/redIcon.svg";

  function Icon(location: { likes: number; place: string }) {
    const showIcon =
      location.like < 10000 ? {icon:blueicon , width:"120", stopColor:"#4FF8F8",startColor:"#4B89ED"} : location.like >= 10000 && location.like < 100000? {icon:greenicon,width:"60",stopColor:"#A7F84F",startColor:"#4BED74"} : location.like >= 100000 && location.like < 500000 ? {icon:redIcon,width:"140",stopColor:"#F84F90",startColor:"#ED4B4B"} : {icon:fireicon,width:"160"};

    const textSVG =
      zoomLevel > 15
        ? `
          <text x="50%" y="50%" dominant-baseline="middle" text-anchor="middle"
        font-size="20" font-weight="bold" fill="white"
        stroke="#ED4B4B" stroke-width="1.2">
        ${location.likes}
      </text>
          `
        : "";


    return L.divIcon({
      className: "custom-marker",
      html: `
              <div style="position: relative; text-align: center;">
      <img src=${showIcon.icon} style="width: 50px; height: 50px;" />

      <div style="position: absolute; top: 140%; left: 130%; transform: translate(-50%, -210%);">
        <svg viewBox="0 0 100 30" width=${showIcon.width} height="40">
          ${textSVG}
        </svg>


      </div>
    </div>
              `,
      iconSize: [50, 50],
      iconAnchor: [25, 25],
    });
  }

  const uniqueArrDistance = Array.from(new Map(arrDistance.map((distance) => [distance.latitude, distance])).values());

   return (
    <div>
    {uniqueArrDistance.map((place, index) => (
        <Marker
          icon={Icon(place)}
          position={[place.latitude, place.longitude]}
          key={index}
        />
    ))}
    </div>
  );
}
showIcon
scaleごとにアイコンの大きさとアイコンの色を変えるための条件分です。
textSVG
もしズームサイズが15より上の時はアイコンの周りにバズ度の表示をします。
おまけ:ピンを選択したら画面真ん中に来るように
googlemapのようにマーカーを選択したら、画面真ん中に選択したマーカーが移動してくるようにしました。
function PinLocate({ arrDistance }: PinLocateProps) {

import blueicon from "../../public/img/blueIcon.svg";
import fireicon from "../../public/img/fireIcon.svg";
import greenicon from "../../public/img/greenIcon.svg";
import redIcon from "../../public/img/redIcon.svg";

  function Icon(location: { likes: number; place: string }) {

    const handleOpen = () => {
      map.setView([place.latitude, place.longitude], 13, {
      animate: true,
    });
    }

   return (
    <div>
    {uniqueArrDistance.map((place, index) => (
        <Marker
          icon={Icon(place)}
          position={[place.latitude, place.longitude]}
          key={index}
          eventHandlers={{ click: () => handleOpen(place) }}
        />
    ))}
    </div>
  );
}
map.setView([place.latitude, place.longitude], 13)
これの13というのがズームサイズです。
最後に
leafletはもともとjavascriptのライブラリなので文献もjavascriptに関しての記載の方が多くて大変でした。誰かの参考になれたら幸いです。