グラフ構造を深層学習する PyG (PyTorch Geometric) を Google Colaboratory 上で使ってみました。今回は、Graph Autoencoders (GAE) と Variational Graph Autoencoders (VGAE) を使うことがテーマです。
PyG (PyTorch Geometric) インストール
PyG (PyTorch Geometric) のレポジトリは https://github.com/pyg-team/pytorch_geometric にあります。また、コードはチュートリアルドキュメント https://pytorch-geometric.readthedocs.io/en/latest/index.html を参考にしています。
import os
import torch

torch.manual_seed(53)
os.environ['TORCH'] = torch.__version__
print(torch.__version__)

!pip install -q torch-scatter -f https://data.pyg.org/whl/torch-${TORCH}.html
!pip install -q torch-sparse -f https://data.pyg.org/whl/torch-${TORCH}.html
!pip install -q git+https://github.com/pyg-team/pytorch_geometric.git

import torch_geometric
1.12.0+cu113
[K     |████████████████████████████████| 7.9 MB 6.8 MB/s
[K     |████████████████████████████████| 3.5 MB 6.5 MB/s
[?25h  Building wheel for torch-geometric (setup.py) ... [?25l[?25hdone
device = torch.device('cuda' if torch.cuda.is_available() else 'cpu')
device = "cpu"
データセットの自作
今回もデータセットを自作します。自作する理由は、生成したネットワーク(グラフ構造)が「本物っぽいかどうか」自分の目で判断しやすくするためです。
GridDataset
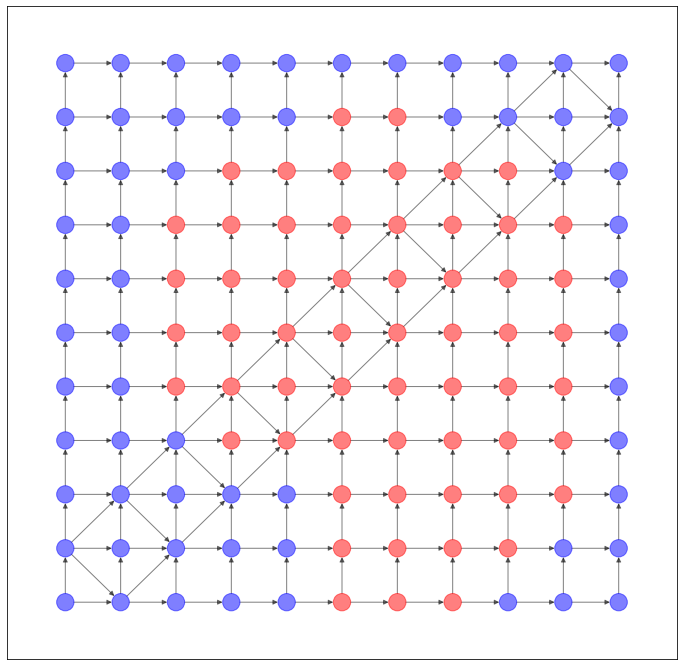
格子状のネットワークのデータセットを作ってみました。
import numpy as np
from scipy.spatial import distance
from torch_geometric.data import Data, InMemoryDataset

class GridDataset(InMemoryDataset):
    def __init__(self, transform = None):
        super().__init__('.', transform)

        f = lambda x: np.linalg.norm(x) - np.arctan2(x[0], x[1])
        embeddings = []
        ys = []
        for x in range(-10, 11, 2):
            for y in range(-10, 11, 2):
                embeddings.append([x, y])
                ys.append(f([x, y]))
        embeddings = torch.tensor(embeddings, dtype=torch.float)
        y2 = []
        for y in ys:
            if y > np.array(ys).mean():
                y2.append(1)
            else:
                y2.append(0)
        ys = torch.tensor(y2, dtype=torch.float)

        dist_matrix = distance.cdist(embeddings, embeddings, metric='euclidean')
        edges = []
        edge_attr = []
        for i in range(len(dist_matrix)):
            for j in range(len(dist_matrix)):
                if i < j:
                    if dist_matrix[i][j] == 2:
                        edges.append([i, j])
                        edge_attr.append(abs(f(embeddings[i]) - f(embeddings[j])))
                    elif dist_matrix[i][j] < 3 and (
                        embeddings[i][0] == embeddings[j][1] or
                        embeddings[i][1] == embeddings[j][0]
                    ):
                        edges.append([i, j])
                        edge_attr.append(abs(f(embeddings[i]) - f(embeddings[j])))

        edges = torch.tensor(edges, dtype=torch.long).T
        edge_attr = torch.tensor(edge_attr, dtype=torch.long)
        data = Data(x=embeddings, edge_index=edges, y=ys, edge_attr=edge_attr)
        self.data, self.slices = self.collate([data])
        self.data.num_nodes = len(embeddings)

    def layout(self):
        return {i:x.detach().numpy() for i, x in enumerate(self.data.x)}

    def node_color(self):
        c = {0:"red", 1:"blue"}
        return [c[int(x.detach().numpy())] for (i, x) in enumerate(self.data.y)]
NetworkX で可視化すると、このようなネットワークになります。
import networkx as nx
import matplotlib.pyplot as plt

dataset = GridDataset()
G = torch_geometric.utils.convert.to_networkx(dataset.data)
plt.figure(figsize=(12,12))
nx.draw_networkx(G, pos=dataset.layout(), with_labels=False, alpha=0.5, node_color=dataset.node_color())
ColonyDataset
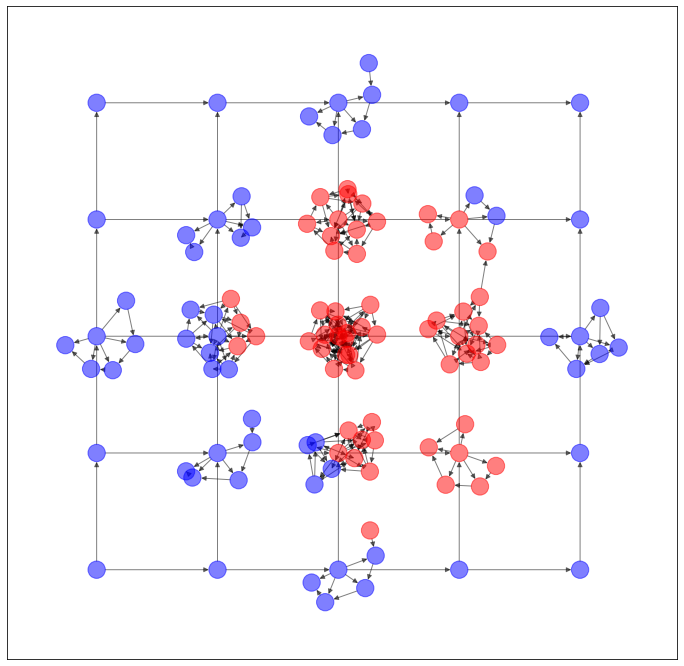
上のような構造のネットワークは、現実世界ではあまり登場しませんので、今度はもうちょっと次数に偏りのあるネットワークを作ってみました。ColonyDataset と命名しましたが、なんとなく大腸菌コロニーを連想したので。いや、似てないって?すみません。
import numpy as np
from scipy.spatial import distance
from torch_geometric.data import Data, InMemoryDataset

class ColonyDataset(InMemoryDataset):
    def __init__(self, transform = None):
        super().__init__('.', transform)

        f = lambda x: np.linalg.norm(x) - np.arctan2(x[0], x[1])
        embeddings = []
        ys = []

        for x in range(-10, 11, 5):
            for y in range(-10, 11, 5):
                embeddings.append([x, y])
                ys.append(f([x, y]))
                for theta in range(max(0, 15 - abs(x) - abs(y))):
                    x2 = x + np.sin(theta + np.random.rand()) * abs(17 - theta) * 0.1
                    y2 = y + np.cos(theta + np.random.rand()) * abs(17 - theta) * 0.1
                    embeddings.append([x2, y2])
                    ys.append(f([x2, y2]))

        embeddings = torch.tensor(embeddings, dtype=torch.float)
        y2 = []
        for y in ys:
            if y > np.array(ys).mean():
                y2.append(1)
            else:
                y2.append(0)
        ys = torch.tensor(y2, dtype=torch.float)

        dist_matrix = distance.cdist(embeddings, embeddings, metric='euclidean')
        edges = []
        edge_attr = []
        for i in range(len(dist_matrix)):
            for j in range(len(dist_matrix)):
                if i < j:
                    if dist_matrix[i][j] == 5 or dist_matrix[i][j] < 2:
                        edges.append([i, j])
                        edge_attr.append(abs(f(embeddings[i]) - f(embeddings[j])))

        edges = torch.tensor(edges).T
        edge_attr = torch.tensor(edge_attr)
        data = Data(x=embeddings, edge_index=edges, y=ys, edge_attr=edge_attr)
        self.data, self.slices = self.collate([data])
        self.data.num_nodes = len(embeddings)

    def layout(self):
        return {i:x.detach().numpy() for i, x in enumerate(self.data.x)}

    def node_color(self):
        c = {0:"red", 1:"blue"}
        return [c[int(x.detach().numpy())] for (i, x) in enumerate(self.data.y)]
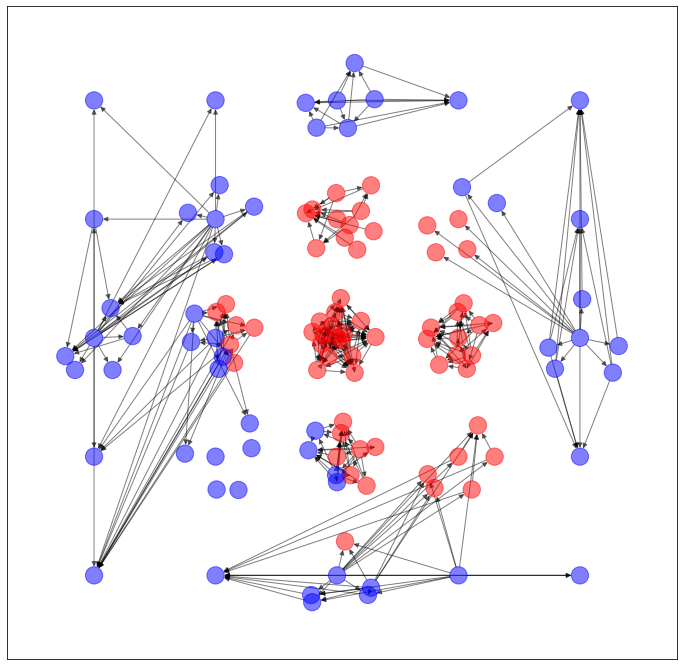
NetworkX で可視化すると、このようなネットワークになります。
import networkx as nx
import matplotlib.pyplot as plt

dataset = ColonyDataset()
G = torch_geometric.utils.convert.to_networkx(dataset.data)
plt.figure(figsize=(12,12))
nx.draw_networkx(G, pos=dataset.layout(), with_labels=False, alpha=0.5, node_color=dataset.node_color())
データセットの選択
次のようにして、どちらのデータセットを使うか選択します。
use_dataset = GridDataset
use_dataset = ColonyDataset
今回は、辺(エッジ)の有無を予測するため、それを train test に分離します。
dataset = use_dataset()
data = dataset.data
data = torch_geometric.utils.train_test_split_edges(data)
/usr/local/lib/python3.7/dist-packages/torch_geometric/deprecation.py:12: UserWarning: 'train_test_split_edges' is deprecated, use 'transforms.RandomLinkSplit' instead
  warnings.warn(out)
Graph Autoencoders (GAE)
まずは Graph Autoencoder (GAE) です。
GCNConv を重ねて、エンコーダー部分を作ります。
class GCNEncoder(torch.nn.Module):
    def __init__(self, in_channels, out_channels):
        super(GCNEncoder, self).__init__()
        self.conv1 = torch_geometric.nn.GCNConv(
            in_channels, 4 * out_channels, cached=True
            )
        self.conv1b = torch_geometric.nn.GCNConv(
            4 * out_channels, 16 * out_channels, cached=True
            )
        self.conv1c = torch_geometric.nn.GCNConv(
            16 * out_channels, 32 * out_channels, cached=True
            )
        self.conv1d = torch_geometric.nn.GCNConv(
            32 * out_channels, 16 * out_channels, cached=True
            )
        self.conv1e = torch_geometric.nn.GCNConv(
            16 * out_channels, 4 * out_channels, cached=True
            )
        self.conv2 = torch_geometric.nn.GCNConv(
            4 * out_channels, out_channels, cached=True
            )

    def forward(self, x, edge_index):
        x = self.conv1(x, edge_index).relu()
        x = self.conv1b(x, edge_index).relu()
        x = self.conv1c(x, edge_index).relu()
        x = self.conv1d(x, edge_index).relu()
        x = self.conv1e(x, edge_index).relu()
        return self.conv2(x, edge_index)
トレーニングとテストのコードです。
def train():
    model.train()
    optimizer.zero_grad()
    z = model.encode(x, train_pos_edge_index)
    loss = model.recon_loss(z, train_pos_edge_index)
    loss.backward()
    optimizer.step()
    return float(loss)

def test(pos_edge_index, neg_edge_index):
    model.eval()
    with torch.no_grad():
        z = model.encode(x, train_pos_edge_index)
    return model.test(z, pos_edge_index, neg_edge_index)
GAE のエンコーダー部分に GCNEncoder をセットします。そのほかの諸設定を行います。
epochs = 500
out_channels = 16

num_features = dataset.num_features
model = torch_geometric.nn.GAE(GCNEncoder(num_features, out_channels))
model = model.to(device)

x = data.x.to(device)
train_pos_edge_index = data.train_pos_edge_index.to(device)

optimizer = torch.optim.Adam(model.parameters(), lr=0.01)
次のようにして学習します。ベストモデルが best_model として保存されます。
import copy

loss_hist = []
auc_hist = []
ap_hist = []
best_score = None
for epoch in range(1, epochs + 1):
    loss = train()
    auc, ap = test(data.test_pos_edge_index, data.test_neg_edge_index)
    loss_hist.append(loss)
    auc_hist.append(auc)
    ap_hist.append(ap)
    if best_score is None or best_score < ap:
        best_score = ap
        best_model = copy.deepcopy(model)
        print('Epoch: {:03d}, AUC: {:.4f}, AP: {:.4f}, Loss: {}'.format(epoch, auc, ap, loss))
Epoch: 001, AUC: 0.3816, AP: 0.4461, Loss: 1.3883142471313477
Epoch: 002, AUC: 0.4190, AP: 0.5396, Loss: 28.98647689819336
Epoch: 003, AUC: 0.4468, AP: 0.5558, Loss: 2.6154823303222656
Epoch: 007, AUC: 0.5818, AP: 0.6184, Loss: 1.3535693883895874
Epoch: 008, AUC: 0.6011, AP: 0.6215, Loss: 1.3591862916946411
Epoch: 009, AUC: 0.6011, AP: 0.6249, Loss: 1.356323003768921
Epoch: 019, AUC: 0.6273, AP: 0.6257, Loss: 1.1663818359375
Epoch: 020, AUC: 0.6875, AP: 0.6798, Loss: 1.1575605869293213
Epoch: 021, AUC: 0.7307, AP: 0.7208, Loss: 1.151369571685791
Epoch: 022, AUC: 0.7616, AP: 0.7486, Loss: 1.1134968996047974
Epoch: 024, AUC: 0.7400, AP: 0.7662, Loss: 1.162852168083191
Epoch: 025, AUC: 0.7739, AP: 0.8188, Loss: 1.1479345560073853
Epoch: 026, AUC: 0.7971, AP: 0.8392, Loss: 1.088531494140625
Epoch: 028, AUC: 0.8187, AP: 0.8483, Loss: 1.163226842880249
Epoch: 029, AUC: 0.8241, AP: 0.8636, Loss: 1.1547914743423462
Epoch: 031, AUC: 0.8403, AP: 0.8695, Loss: 1.1620863676071167
Epoch: 047, AUC: 0.8557, AP: 0.8755, Loss: 1.0460742712020874
Epoch: 048, AUC: 0.8642, AP: 0.8834, Loss: 1.0296823978424072
Epoch: 054, AUC: 0.8819, AP: 0.8876, Loss: 0.9689010381698608
Epoch: 055, AUC: 0.8927, AP: 0.9002, Loss: 0.9880993366241455
Epoch: 056, AUC: 0.8966, AP: 0.9042, Loss: 0.9827735424041748
Epoch: 078, AUC: 0.8943, AP: 0.9057, Loss: 0.9343335628509521
Epoch: 079, AUC: 0.9005, AP: 0.9136, Loss: 0.9135234951972961
Epoch: 121, AUC: 0.8997, AP: 0.9142, Loss: 0.9891144037246704
Epoch: 128, AUC: 0.9043, AP: 0.9154, Loss: 0.9204936027526855
Epoch: 132, AUC: 0.9144, AP: 0.9266, Loss: 0.9302182197570801
Epoch: 147, AUC: 0.9151, AP: 0.9295, Loss: 0.8523568511009216
Epoch: 154, AUC: 0.9182, AP: 0.9295, Loss: 0.8805981278419495
Epoch: 157, AUC: 0.9136, AP: 0.9296, Loss: 0.8795582056045532
Epoch: 163, AUC: 0.9244, AP: 0.9356, Loss: 0.8179492354393005
Epoch: 164, AUC: 0.9252, AP: 0.9393, Loss: 0.8485832810401917
Epoch: 198, AUC: 0.9267, AP: 0.9437, Loss: 0.8306972980499268
Epoch: 237, AUC: 0.9190, AP: 0.9469, Loss: 0.7869285941123962
Epoch: 241, AUC: 0.9213, AP: 0.9482, Loss: 0.7720121145248413
Epoch: 243, AUC: 0.9236, AP: 0.9491, Loss: 0.7884184122085571
Epoch: 244, AUC: 0.9236, AP: 0.9499, Loss: 0.7504099607467651
Epoch: 247, AUC: 0.9298, AP: 0.9521, Loss: 0.7511246800422668
Epoch: 248, AUC: 0.9375, AP: 0.9549, Loss: 0.7275109887123108
Epoch: 250, AUC: 0.9414, AP: 0.9558, Loss: 0.7692357897758484
Epoch: 458, AUC: 0.9282, AP: 0.9560, Loss: 0.6997581720352173
Epoch: 459, AUC: 0.9298, AP: 0.9564, Loss: 0.7822049260139465
Epoch: 460, AUC: 0.9321, AP: 0.9574, Loss: 0.7706275582313538
Epoch: 461, AUC: 0.9321, AP: 0.9580, Loss: 0.7076061367988586
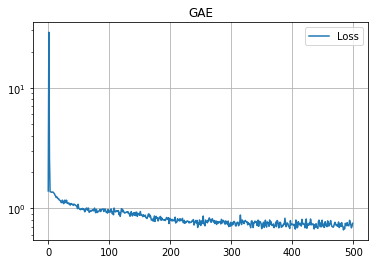
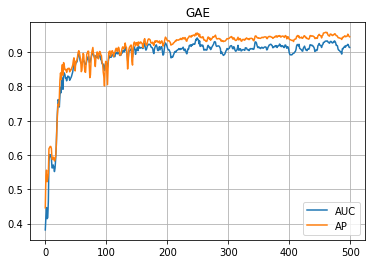
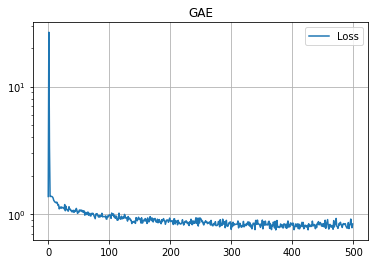
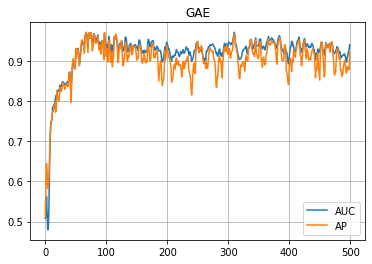
学習の履歴は次のようになりました。
import matplotlib.pyplot as plt

plt.title("GAE")
plt.plot(loss_hist, label="Loss")
plt.grid()
plt.legend()
plt.yscale('log')
plt.show()
plt.title("GAE")
plt.plot(auc_hist, label="AUC")
plt.plot(ap_hist, label="AP")
plt.grid()
plt.legend()
plt.show()
学習はできたので、次は(辺の)予測です。エンコーダーで算出した z を利用して、予測された隣接行列(っぽいもの)を算出します。
z = best_model.encode(x, train_pos_edge_index)
prob_adj = z @ z.T
prob_adj = prob_adj - torch.diagonal(prob_adj)
prob_adj
tensor([[ 0.0000, -0.0693, -2.5038,  ..., -3.5280, -2.4522, -1.7510],
        [ 0.0406,  0.0000, -2.2706,  ..., -3.5723, -2.5015, -1.7879],
        [ 0.4745,  0.5979,  0.0000,  ..., -3.6429, -2.6418, -1.8696],
        ...,
        [-0.9027, -1.0568, -3.9960,  ...,  0.0000,  0.4723,  0.7083],
        [-0.9423, -1.1015, -4.1102,  ..., -0.6431,  0.0000,  0.2936],
        [-0.8921, -1.0387, -3.9890,  ..., -1.0580, -0.3573,  0.0000]],
       grad_fn=<SubBackward0>)
この値が閾値以上の場合に「隣接する」と考えたいと思います。閾値 threshold は 0 でも良いかもしれませんが、今回はこのように算出してみました。
prob_adj_values = prob_adj.detach().cpu().numpy().flatten()
prob_adj_values.sort()
dataset = use_dataset()
threshold = prob_adj_values[-len(dataset.data.edge_attr)]
dataset.data.edge_index = (prob_adj >= threshold).nonzero(as_tuple=False).t()
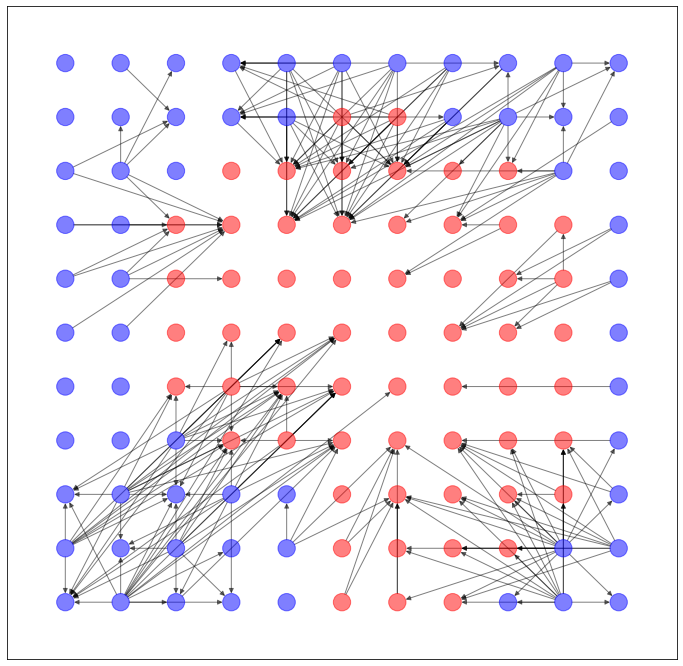
以上のように予測された辺を用いて、ネットワークを生成します。
import networkx as nx
import matplotlib.pyplot as plt

G = torch_geometric.utils.convert.to_networkx(dataset.data)
plt.figure(figsize=(12,12))
nx.draw_networkx(G, pos=dataset.layout(), with_labels=False, alpha=0.5, node_color=dataset.node_color())
...うーん、元のネットワークの特徴を残してる気がしないでもないですが...まだ改良の余地ありそうですね。
Variational Graph Autoencoders (VGAE)
次は Variational Graph Autoencoders (VGAE) です。先ほどと同様に、エンコーダー部分に入れる VariationalGCNEncoder を作ります。
class VariationalGCNEncoder(torch.nn.Module):
    def __init__(self, in_channels, out_channels):
        super(VariationalGCNEncoder, self).__init__()
        self.conv1 = torch_geometric.nn.GCNConv(
            in_channels, 4 * out_channels, cached=True
            )
        self.conv1b = torch_geometric.nn.GCNConv(
            4 * out_channels, 16 * out_channels, cached=True
            )
        self.conv1c = torch_geometric.nn.GCNConv(
            16 * out_channels, 32 * out_channels, cached=True
            )
        self.conv1d = torch_geometric.nn.GCNConv(
            32 * out_channels, 16 * out_channels, cached=True
            )
        self.conv1e = torch_geometric.nn.GCNConv(
            16 * out_channels, 4 * out_channels, cached=True
            )
        self.conv_mu = torch_geometric.nn.GCNConv(
            4 * out_channels, out_channels, cached=True
            )
        self.conv_logstd = torch_geometric.nn.GCNConv(
            4 * out_channels, out_channels, cached=True
            )

    def forward(self, x, edge_index):
        x = self.conv1(x, edge_index).relu()
        x = self.conv1b(x, edge_index).relu()
        x = self.conv1c(x, edge_index).relu()
        x = self.conv1d(x, edge_index).relu()
        x = self.conv1e(x, edge_index).relu()
        return self.conv_mu(x, edge_index), self.conv_logstd(x, edge_index)
トレーニングとテストのコードです。
def train():
    model.train()
    optimizer.zero_grad()
    z = model.encode(x, train_pos_edge_index)
    loss = model.recon_loss(z, train_pos_edge_index)
    loss = loss + (1 / data.num_nodes) * model.kl_loss()
    loss.backward()
    optimizer.step()
    return float(loss)

def test(pos_edge_index, neg_edge_index):
    model.eval()
    with torch.no_grad():
        z = model.encode(x, train_pos_edge_index)
    return model.test(z, pos_edge_index, neg_edge_index)
VGAE のエンコーダー部分に VariationalGCNEncoder をセットします。そのほかの諸設定を行います。
epochs = 500
out_channels = 16

num_features = dataset.num_features
model = torch_geometric.nn.VGAE(
    VariationalGCNEncoder(num_features, out_channels)
    )
model = model.to(device)

x = data.x.to(device)
train_pos_edge_index = data.train_pos_edge_index.to(device)

optimizer = torch.optim.Adam(model.parameters(), lr=0.01)
次のようにして学習します。ベストモデルが best_model として保存されます。
import copy

loss_hist = []
auc_hist = []
ap_hist = []
best_score = None
for epoch in range(1, epochs + 1):
    loss = train()
    auc, ap = test(data.test_pos_edge_index, data.test_neg_edge_index)
    loss_hist.append(loss)
    auc_hist.append(auc)
    ap_hist.append(ap)
    if best_score is None or best_score < ap:
        best_score = ap
        best_model = copy.deepcopy(model)
        print('Epoch: {:03d}, AUC: {:.4f}, AP: {:.4f}, Loss: {}'.format(epoch, auc, ap, loss))
Epoch: 001, AUC: 0.3731, AP: 0.4432, Loss: 3.864459276199341
Epoch: 002, AUC: 0.4028, AP: 0.5502, Loss: 18.978899002075195
Epoch: 003, AUC: 0.4282, AP: 0.5533, Loss: 5.359278202056885
Epoch: 004, AUC: 0.4151, AP: 0.5543, Loss: 2.7068936824798584
Epoch: 005, AUC: 0.4082, AP: 0.5561, Loss: 3.064584493637085
Epoch: 015, AUC: 0.4846, AP: 0.5571, Loss: 1.5492334365844727
Epoch: 016, AUC: 0.4715, AP: 0.5571, Loss: 1.5692222118377686
Epoch: 017, AUC: 0.4946, AP: 0.5910, Loss: 1.55221426486969
Epoch: 018, AUC: 0.5679, AP: 0.6442, Loss: 1.5478882789611816
Epoch: 019, AUC: 0.6620, AP: 0.7120, Loss: 1.5624383687973022
Epoch: 020, AUC: 0.7137, AP: 0.7338, Loss: 1.5453048944473267
Epoch: 021, AUC: 0.7353, AP: 0.7453, Loss: 1.506240725517273
Epoch: 022, AUC: 0.7623, AP: 0.7691, Loss: 1.4864426851272583
Epoch: 023, AUC: 0.7600, AP: 0.7808, Loss: 1.468309760093689
Epoch: 024, AUC: 0.7600, AP: 0.7853, Loss: 1.4616118669509888
Epoch: 025, AUC: 0.7454, AP: 0.7881, Loss: 1.4413743019104004
Epoch: 029, AUC: 0.7585, AP: 0.8036, Loss: 1.4201958179473877
Epoch: 030, AUC: 0.7778, AP: 0.8204, Loss: 1.2653322219848633
Epoch: 031, AUC: 0.7878, AP: 0.8252, Loss: 1.299864649772644
Epoch: 033, AUC: 0.7994, AP: 0.8289, Loss: 1.2688895463943481
Epoch: 051, AUC: 0.8040, AP: 0.8343, Loss: 1.2111725807189941
Epoch: 052, AUC: 0.8056, AP: 0.8437, Loss: 1.2464674711227417
Epoch: 053, AUC: 0.8102, AP: 0.8484, Loss: 1.22722327709198
Epoch: 054, AUC: 0.8318, AP: 0.8598, Loss: 1.2544875144958496
Epoch: 055, AUC: 0.8511, AP: 0.8734, Loss: 1.2202423810958862
Epoch: 056, AUC: 0.8627, AP: 0.8793, Loss: 1.2152200937271118
Epoch: 057, AUC: 0.8742, AP: 0.8829, Loss: 1.2272169589996338
Epoch: 062, AUC: 0.8711, AP: 0.8852, Loss: 1.1996705532073975
Epoch: 077, AUC: 0.8881, AP: 0.8916, Loss: 1.1212635040283203
Epoch: 078, AUC: 0.8943, AP: 0.8941, Loss: 1.137722373008728
Epoch: 085, AUC: 0.8989, AP: 0.9014, Loss: 1.1602625846862793
Epoch: 094, AUC: 0.8935, AP: 0.9029, Loss: 1.0816481113433838
Epoch: 099, AUC: 0.9020, AP: 0.9099, Loss: 1.131610631942749
Epoch: 100, AUC: 0.9028, AP: 0.9101, Loss: 1.047181487083435
Epoch: 107, AUC: 0.9020, AP: 0.9104, Loss: 1.1225495338439941
Epoch: 112, AUC: 0.9005, AP: 0.9166, Loss: 1.0279103517532349
Epoch: 116, AUC: 0.9020, AP: 0.9196, Loss: 1.0380473136901855
Epoch: 120, AUC: 0.9059, AP: 0.9242, Loss: 1.1030912399291992
Epoch: 125, AUC: 0.9051, AP: 0.9244, Loss: 0.9978398084640503
Epoch: 126, AUC: 0.9090, AP: 0.9296, Loss: 1.039618730545044
Epoch: 131, AUC: 0.9174, AP: 0.9303, Loss: 1.0598678588867188
Epoch: 137, AUC: 0.9205, AP: 0.9328, Loss: 1.0251210927963257
Epoch: 141, AUC: 0.9221, AP: 0.9354, Loss: 1.0087817907333374
Epoch: 145, AUC: 0.9244, AP: 0.9402, Loss: 1.054215908050537
Epoch: 147, AUC: 0.9290, AP: 0.9415, Loss: 1.0088623762130737
Epoch: 148, AUC: 0.9336, AP: 0.9455, Loss: 1.0282702445983887
Epoch: 198, AUC: 0.9321, AP: 0.9457, Loss: 1.033915400505066
Epoch: 199, AUC: 0.9344, AP: 0.9482, Loss: 0.9904683828353882
Epoch: 283, AUC: 0.9329, AP: 0.9490, Loss: 0.9304066896438599
Epoch: 311, AUC: 0.9360, AP: 0.9509, Loss: 0.9486202597618103
Epoch: 312, AUC: 0.9406, AP: 0.9549, Loss: 0.9481338262557983
Epoch: 358, AUC: 0.9406, AP: 0.9560, Loss: 1.0044310092926025
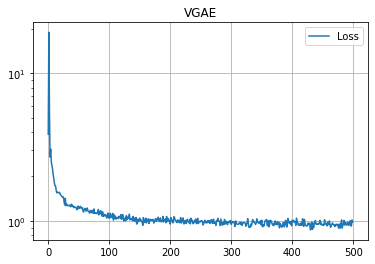
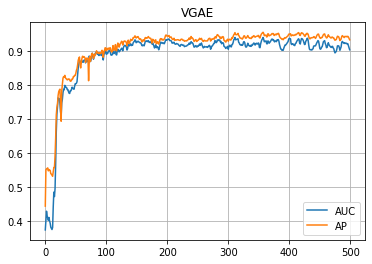
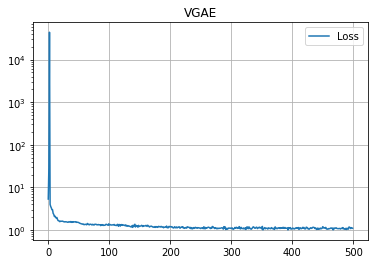
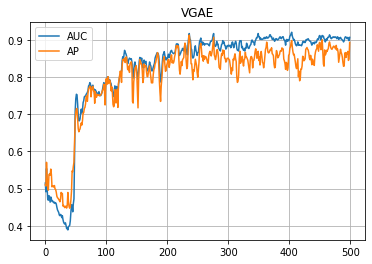
学習の履歴は次のようになりました。
import matplotlib.pyplot as plt

plt.title("VGAE")
plt.plot(loss_hist, label="Loss")
plt.grid()
plt.legend()
plt.yscale('log')
plt.show()
plt.title("VGAE")
plt.plot(auc_hist, label="AUC")
plt.plot(ap_hist, label="AP")
plt.grid()
plt.legend()
plt.show()
学習はできたので、次は(辺の)予測です。エンコーダーで算出した z を利用して、予測された隣接行列(っぽいもの)を算出します。
z = best_model.encode(x, train_pos_edge_index)
prob_adj = z @ z.T
prob_adj = prob_adj - torch.diagonal(prob_adj)
prob_adj
tensor([[ 0.0000, -0.2043, -1.2594,  ..., -2.0548, -1.1037, -0.7604],
        [ 0.1644,  0.0000, -1.0084,  ..., -2.1810, -1.2070, -0.8390],
        [ 0.2415,  0.1238,  0.0000,  ..., -2.0992, -1.3040, -0.9518],
        ...,
        [-1.2879, -1.7827, -2.8331,  ...,  0.0000, -0.1195, -0.0661],
        [-1.2505, -1.7225, -2.9517,  ..., -1.0332,  0.0000,  0.0888],
        [-1.1217, -1.5690, -2.8140,  ..., -1.1944, -0.1257,  0.0000]],
       grad_fn=<SubBackward0>)
この値が閾値以上の場合に「隣接する」と考えたいと思います。閾値 threshold は 0 でも良いかもしれませんが、今回はこのように算出してみました。
prob_adj_values = prob_adj.detach().cpu().numpy().flatten()
prob_adj_values.sort()
dataset = use_dataset()
threshold = prob_adj_values[-len(dataset.data.edge_attr)]
dataset.data.edge_index = (prob_adj >= threshold).nonzero(as_tuple=False).t()
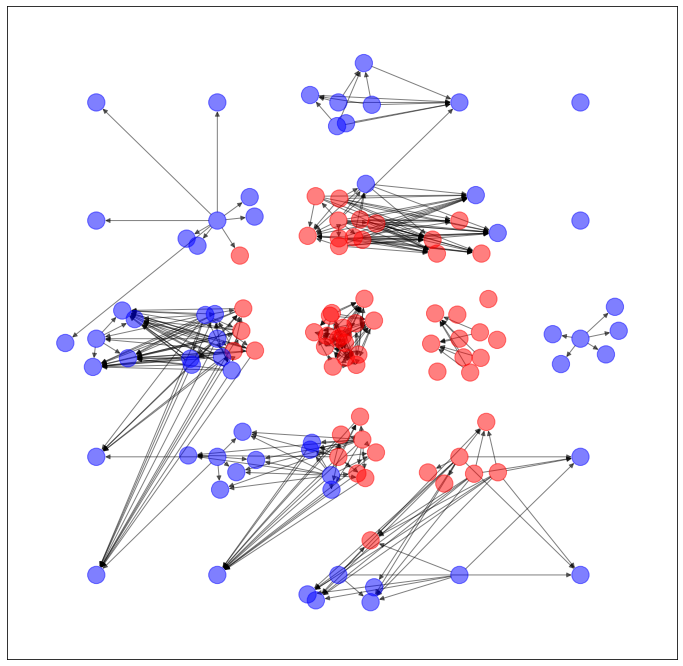
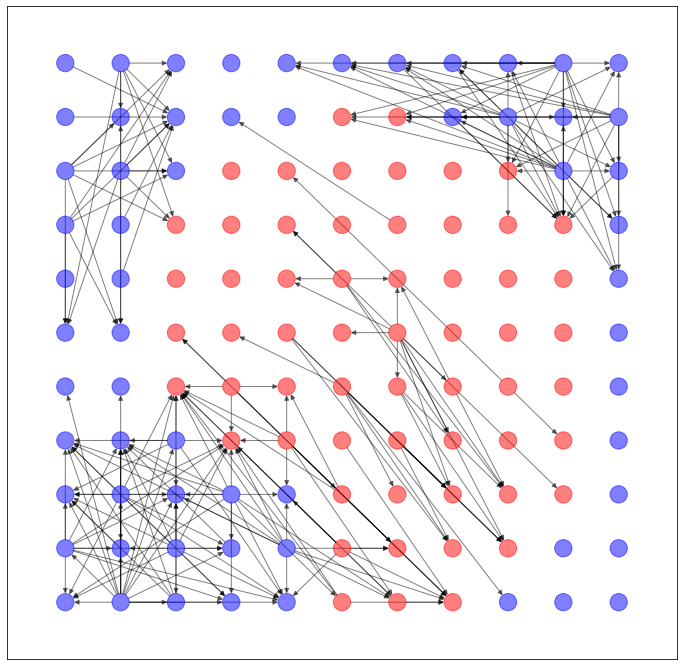
以上のように予測された辺を用いて、ネットワークを生成します。
import networkx as nx
import matplotlib.pyplot as plt

G = torch_geometric.utils.convert.to_networkx(dataset.data)
plt.figure(figsize=(12,12))
nx.draw_networkx(G, pos=dataset.layout(), with_labels=False, alpha=0.5, node_color=dataset.node_color())
うーん...GAEとVGAE、どっちが良いか微妙ですね。
データセットを変える
GridDatasetでも同様に計算してみました。
GAE
VGAE
GridDataset、意外と難しいんですね。そして、データセットを変えると、当然ながら生成されるネットワークの特徴も変わることが改めて実感できたというか。
