import numpy as np
import matplotlib.pyplot as plt
from sklearn.linear_model import LinearRegression

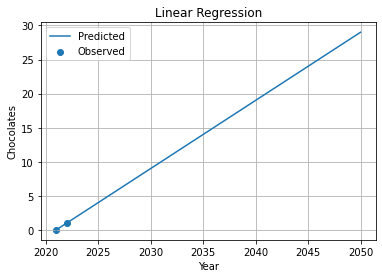
chocolates = np.array([0, 1]).reshape(1, -1).T
year = np.array([2021, 2022]).reshape(1, -1).T
model = LinearRegression()
model.fit(year, chocolates)
future = np.linspace(2021, 2050, 30).reshape(1, -1).T
plt.scatter(year, chocolates, label="Observed")
plt.plot(future, model.predict(future), label="Predicted")
plt.title("Linear Regression")
plt.xlabel("Year")
plt.ylabel("Chocolates")
plt.grid()
plt.legend()
plt.show()
More than 3 years have passed since last update.
Register as a new user and use Qiita more conveniently
- You get articles that match your needs
- You can efficiently read back useful information
- You can use dark theme
