グラフ構造を深層学習する PyG (PyTorch Geometric) を Google Colaboratory 上で使ってみました。今回は、Adversarially Regularized Variational Graph Auto-Encoder (ARGVA) を使うことがテーマです。
PyG (PyTorch Geometric) インストール
PyG (PyTorch Geometric) のレポジトリは https://github.com/pyg-team/pytorch_geometric にあります。また、コードはチュートリアルドキュメント https://pytorch-geometric.readthedocs.io/en/latest/index.html を参考にしています。
import os
import torch

torch.manual_seed(53)
os.environ['TORCH'] = torch.__version__
print(torch.__version__)

!pip install -q torch-scatter -f https://data.pyg.org/whl/torch-${TORCH}.html
!pip install -q torch-sparse -f https://data.pyg.org/whl/torch-${TORCH}.html
!pip install -q git+https://github.com/pyg-team/pytorch_geometric.git

import torch_geometric
1.12.0+cu113
[K     |████████████████████████████████| 7.9 MB 30.4 MB/s
[K     |████████████████████████████████| 3.5 MB 40.4 MB/s
[?25h  Building wheel for torch-geometric (setup.py) ... [?25l[?25hdone
device = torch.device('cuda' if torch.cuda.is_available() else 'cpu')
device = "cpu"
データセットの自作
過去記事と同じく、データセットを自作します。自作する理由は、生成したネットワーク(グラフ構造)が「本物っぽいかどうか」自分の目で判断しやすくするためです。
GridDataset
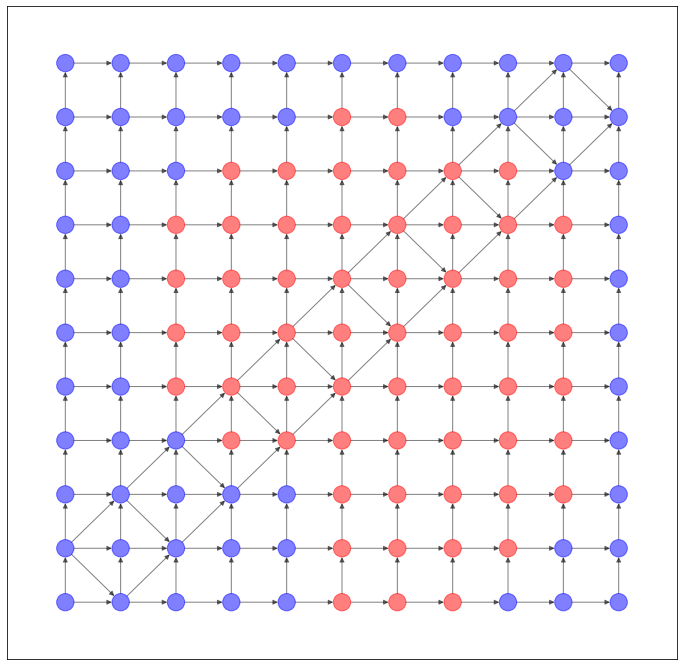
格子状のネットワークのデータセットを作ってみました。
import numpy as np
from scipy.spatial import distance
from torch_geometric.data import Data, InMemoryDataset

class GridDataset(InMemoryDataset):
    def __init__(self, transform = None):
        super().__init__('.', transform)

        f = lambda x: np.linalg.norm(x) - np.arctan2(x[0], x[1])
        embeddings = []
        ys = []
        for x in range(-10, 11, 2):
            for y in range(-10, 11, 2):
                embeddings.append([x, y])
                ys.append(f([x, y]))
        embeddings = torch.tensor(embeddings, dtype=torch.float)
        y2 = []
        for y in ys:
            if y > np.array(ys).mean():
                y2.append(1)
            else:
                y2.append(0)
        ys = torch.tensor(y2, dtype=torch.float)

        dist_matrix = distance.cdist(embeddings, embeddings, metric='euclidean')
        edges = []
        edge_attr = []
        for i in range(len(dist_matrix)):
            for j in range(len(dist_matrix)):
                if i < j:
                    if dist_matrix[i][j] == 2:
                        edges.append([i, j])
                        edge_attr.append(abs(f(embeddings[i]) - f(embeddings[j])))
                    elif dist_matrix[i][j] < 3 and (
                        embeddings[i][0] == embeddings[j][1] or
                        embeddings[i][1] == embeddings[j][0]
                    ):
                        edges.append([i, j])
                        edge_attr.append(abs(f(embeddings[i]) - f(embeddings[j])))

        edges = torch.tensor(edges, dtype=torch.long).T
        edge_attr = torch.tensor(edge_attr, dtype=torch.long)
        data = Data(x=embeddings, edge_index=edges, y=ys, edge_attr=edge_attr)
        self.data, self.slices = self.collate([data])
        self.data.num_nodes = len(embeddings)

    def layout(self):
        return {i:x.detach().numpy() for i, x in enumerate(self.data.x)}

    def node_color(self):
        c = {0:"red", 1:"blue"}
        return [c[int(x.detach().numpy())] for (i, x) in enumerate(self.data.y)]
NetworkX で可視化すると、このようなネットワークになります。
import networkx as nx
import matplotlib.pyplot as plt

dataset = GridDataset()
G = torch_geometric.utils.convert.to_networkx(dataset.data)
plt.figure(figsize=(12,12))
nx.draw_networkx(G, pos=dataset.layout(), with_labels=False, alpha=0.5, node_color=dataset.node_color())
ColonyDataset
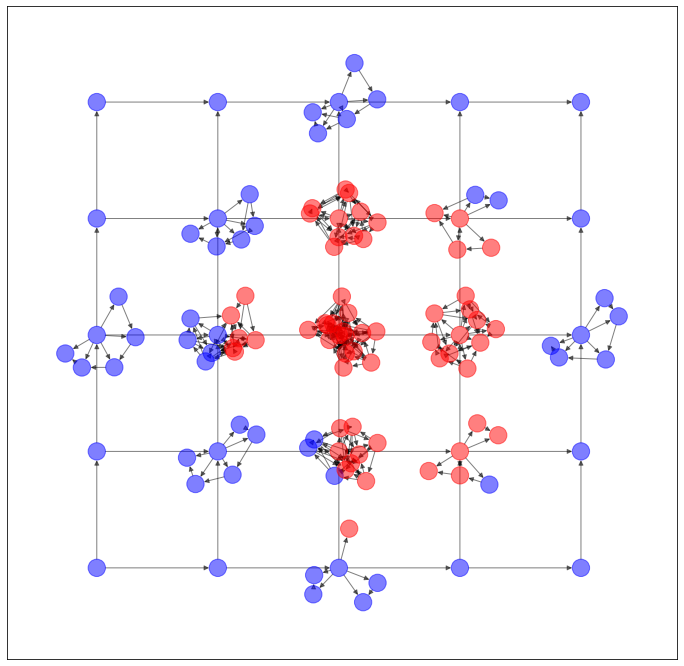
上のような構造のネットワークは、現実世界ではあまり登場しませんので、今度はもうちょっと次数に偏りのあるネットワークを作ってみました。ColonyDataset と命名しましたが、なんとなく大腸菌コロニーを連想したので。いや、似てないって?すみません。
import numpy as np
from scipy.spatial import distance
from torch_geometric.data import Data, InMemoryDataset

class ColonyDataset(InMemoryDataset):
    def __init__(self, transform = None):
        super().__init__('.', transform)

        f = lambda x: np.linalg.norm(x) - np.arctan2(x[0], x[1])
        embeddings = []
        ys = []

        for x in range(-10, 11, 5):
            for y in range(-10, 11, 5):
                embeddings.append([x, y])
                ys.append(f([x, y]))
                for theta in range(max(0, 15 - abs(x) - abs(y))):
                    x2 = x + np.sin(theta + np.random.rand()) * abs(17 - theta) * 0.1
                    y2 = y + np.cos(theta + np.random.rand()) * abs(17 - theta) * 0.1
                    embeddings.append([x2, y2])
                    ys.append(f([x2, y2]))

        embeddings = torch.tensor(embeddings, dtype=torch.float)
        y2 = []
        for y in ys:
            if y > np.array(ys).mean():
                y2.append(1)
            else:
                y2.append(0)
        ys = torch.tensor(y2, dtype=torch.float)

        dist_matrix = distance.cdist(embeddings, embeddings, metric='euclidean')
        edges = []
        edge_attr = []
        for i in range(len(dist_matrix)):
            for j in range(len(dist_matrix)):
                if i < j:
                    if dist_matrix[i][j] == 5 or dist_matrix[i][j] < 2:
                        edges.append([i, j])
                        edge_attr.append(abs(f(embeddings[i]) - f(embeddings[j])))

        edges = torch.tensor(edges).T
        edge_attr = torch.tensor(edge_attr)
        data = Data(x=embeddings, edge_index=edges, y=ys, edge_attr=edge_attr)
        self.data, self.slices = self.collate([data])
        self.data.num_nodes = len(embeddings)

    def layout(self):
        return {i:x.detach().numpy() for i, x in enumerate(self.data.x)}

    def node_color(self):
        c = {0:"red", 1:"blue"}
        return [c[int(x.detach().numpy())] for (i, x) in enumerate(self.data.y)]
NetworkX で可視化すると、このようなネットワークになります。
import networkx as nx
import matplotlib.pyplot as plt

dataset = ColonyDataset()
G = torch_geometric.utils.convert.to_networkx(dataset.data)
plt.figure(figsize=(12,12))
nx.draw_networkx(G, pos=dataset.layout(), with_labels=False, alpha=0.5, node_color=dataset.node_color())
データセットの選択
次のようにして、どちらのデータセットを使うか選択します。
use_dataset = GridDataset
use_dataset = ColonyDataset
今回は、辺(エッジ)の有無を予測するため、それを train test に分離します。
dataset = use_dataset()
data = dataset.data
data = torch_geometric.utils.train_test_split_edges(data)
/usr/local/lib/python3.7/dist-packages/torch_geometric/deprecation.py:12: UserWarning: 'train_test_split_edges' is deprecated, use 'transforms.RandomLinkSplit' instead
  warnings.warn(out)
Adversarially Regularized Variational Graph Auto-Encoder (ARGVA)
さて、ここからが過去記事と違うところです。Adversarially Regularized Variational Graph Auto-Encoder (ARGVA) は、Generative Adversarial Network(GAN)の一種なので、生成器と判別器を作る必要があります。
生成器
生成器を次のようにGCNConvで作ります。
class VEncoder(torch.nn.Module):
    def __init__(self, in_channels, out_channels):
        super(VEncoder, self).__init__()
        self.conv1 = torch_geometric.nn.GCNConv(
            in_channels, 4 * out_channels, cached=True
            )
        self.conv1b = torch_geometric.nn.GCNConv(
            4 * out_channels, 8 * out_channels, cached=True
            )
        self.conv1c = torch_geometric.nn.GCNConv(
            8 * out_channels, 16 * out_channels, cached=True
            )
        self.conv1d = torch_geometric.nn.GCNConv(
            16 * out_channels, 8 * out_channels, cached=True
            )
        self.conv1e = torch_geometric.nn.GCNConv(
            8 * out_channels, 4 * out_channels, cached=True
            )
        self.conv_mu = torch_geometric.nn.GCNConv(
            4 * out_channels, out_channels, cached=True
            )
        self.conv_logstd = torch_geometric.nn.GCNConv(
            4 * out_channels, out_channels, cached=True
            )

    def forward(self, x, edge_index):
        x = torch.nn.functional.relu(self.conv1(x, edge_index))
        x = torch.nn.functional.relu(self.conv1b(x, edge_index))
        x = torch.nn.functional.relu(self.conv1c(x, edge_index))
        x = torch.nn.functional.relu(self.conv1d(x, edge_index))
        x = torch.nn.functional.relu(self.conv1e(x, edge_index))
        return self.conv_mu(x, edge_index), self.conv_logstd(x, edge_index)
判別器
判別器は単純なMulti-layer Perceptron(MLP)で作りました。
class Discriminator(torch.nn.Module):
    def __init__(self, in_channels, hidden_channels, out_channels):
        super(Discriminator, self).__init__()
        self.lin1 = torch.nn.Linear(in_channels, hidden_channels)
        self.lin2 = torch.nn.Linear(hidden_channels, 4 * hidden_channels)
        self.lin2b = torch.nn.Linear(4 * hidden_channels, 8 * hidden_channels)
        self.lin2c = torch.nn.Linear(8 * hidden_channels, 16 * hidden_channels)
        self.lin2d = torch.nn.Linear(16 * hidden_channels, 8 * hidden_channels)
        self.lin2e = torch.nn.Linear(8 * hidden_channels, 4 * hidden_channels)
        self.lin2f = torch.nn.Linear(4 * hidden_channels, hidden_channels)
        self.lin3 = torch.nn.Linear(hidden_channels, out_channels)

    def forward(self, x):
        x = torch.nn.functional.relu(self.lin1(x))
        x = torch.nn.functional.relu(self.lin2(x))
        x = torch.nn.functional.relu(self.lin2b(x))
        x = torch.nn.functional.relu(self.lin2c(x))
        x = torch.nn.functional.relu(self.lin2d(x))
        x = torch.nn.functional.relu(self.lin2e(x))
        x = torch.nn.functional.relu(self.lin2f(x))
        x = self.lin3(x)
        return x
学習
学習のためのコードは次の通りです。
def train():
    model.train()
    encoder_optimizer.zero_grad()
    z = model.encode(data.x, data.train_pos_edge_index)

    for i in range(5):
        idx = range(data.num_nodes)
        discriminator.train()
        discriminator_optimizer.zero_grad()
        discriminator_loss = model.discriminator_loss(z[idx])
        discriminator_loss.backward(retain_graph=True)
        discriminator_optimizer.step()

    loss = 0
    loss = loss + model.reg_loss(z)
    loss = loss + model.recon_loss(z, data.train_pos_edge_index)
    loss = loss + (1 / data.num_nodes) * model.kl_loss()
    loss.backward()
    encoder_optimizer.step()
    return loss

@torch.no_grad()
def test():
    model.eval()
    z = model.encode(data.x, data.train_pos_edge_index)
    auc, ap = model.test(z, data.test_pos_edge_index, data.test_neg_edge_index)
    return auc, ap
モデルとオプティマイザを次のようにセットします。
latent_size = 32
encoder = VEncoder(data.num_features, out_channels=latent_size)
discriminator = Discriminator(
    in_channels=latent_size, hidden_channels=64, out_channels=1
    )

model = torch_geometric.nn.models.autoencoder.ARGVA(encoder, discriminator)
model, data = model.to(device), data.to(device)

discriminator_optimizer = torch.optim.Adam(discriminator.parameters(), lr=0.001)
encoder_optimizer = torch.optim.Adam(encoder.parameters(), lr=0.005)
学習を実行し、ベストモデルを best_model として保存します。
best_score = None
loss_hist = []
auc_hist = []
ap_hist = []
for epoch in range(1001):
    loss = train()
    auc, ap = test()
    loss_hist.append(loss.detach().cpu().numpy())
    auc_hist.append(auc)
    ap_hist.append(ap)
    if best_score is None or best_score < ap:
        best_score = ap
        best_model = model
        print((f'Epoch: {epoch+1:03d}, Loss: {loss:.5f}, AUC: {auc:.5f}, '
            f'AP: {ap:.5f} '))
Epoch: 001, Loss: 5.80309, AUC: 0.43265, AP: 0.58687
Epoch: 006, Loss: 4.06040, AUC: 0.47347, AP: 0.60492
Epoch: 007, Loss: 4.24718, AUC: 0.49469, AP: 0.63466
Epoch: 008, Loss: 4.20496, AUC: 0.50367, AP: 0.63849
Epoch: 009, Loss: 3.87698, AUC: 0.52245, AP: 0.64030
Epoch: 018, Loss: 4.24228, AUC: 0.62122, AP: 0.64656
Epoch: 019, Loss: 4.19824, AUC: 0.63020, AP: 0.65266
Epoch: 026, Loss: 4.56242, AUC: 0.72245, AP: 0.71477
Epoch: 031, Loss: 4.38125, AUC: 0.82204, AP: 0.78456
Epoch: 032, Loss: 4.65734, AUC: 0.86286, AP: 0.83512
Epoch: 034, Loss: 4.67356, AUC: 0.86041, AP: 0.84060
Epoch: 035, Loss: 4.13077, AUC: 0.87755, AP: 0.85429
Epoch: 036, Loss: 4.24425, AUC: 0.86939, AP: 0.88094
Epoch: 071, Loss: 4.38994, AUC: 0.86204, AP: 0.88302
Epoch: 076, Loss: 4.24334, AUC: 0.85469, AP: 0.88342
Epoch: 077, Loss: 4.35317, AUC: 0.85796, AP: 0.88683
Epoch: 078, Loss: 4.09883, AUC: 0.86041, AP: 0.88846
Epoch: 114, Loss: 4.52308, AUC: 0.91429, AP: 0.91523
Epoch: 139, Loss: 4.15654, AUC: 0.93306, AP: 0.92913
Epoch: 140, Loss: 4.15006, AUC: 0.93551, AP: 0.93443
Epoch: 260, Loss: 4.14499, AUC: 0.92735, AP: 0.94009
Epoch: 265, Loss: 3.92756, AUC: 0.92980, AP: 0.94059
Epoch: 266, Loss: 3.93812, AUC: 0.93306, AP: 0.94492
Epoch: 336, Loss: 3.97783, AUC: 0.92245, AP: 0.94506
Epoch: 340, Loss: 4.14164, AUC: 0.92816, AP: 0.94805
Epoch: 362, Loss: 4.08637, AUC: 0.93878, AP: 0.95068
Epoch: 363, Loss: 3.88312, AUC: 0.94204, AP: 0.95141
Epoch: 371, Loss: 4.07849, AUC: 0.93714, AP: 0.95423
Epoch: 381, Loss: 3.78562, AUC: 0.95755, AP: 0.96242
Epoch: 382, Loss: 4.01396, AUC: 0.98286, AP: 0.98323
Epoch: 383, Loss: 4.24790, AUC: 0.98531, AP: 0.98490
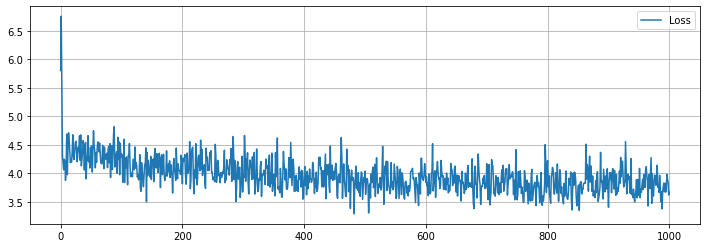
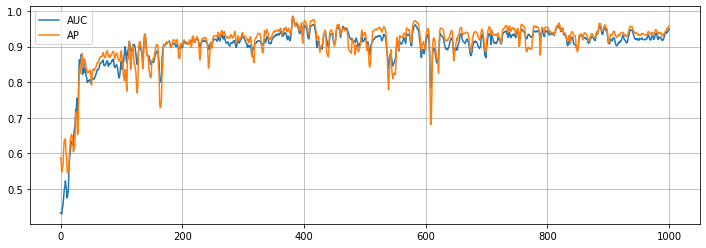
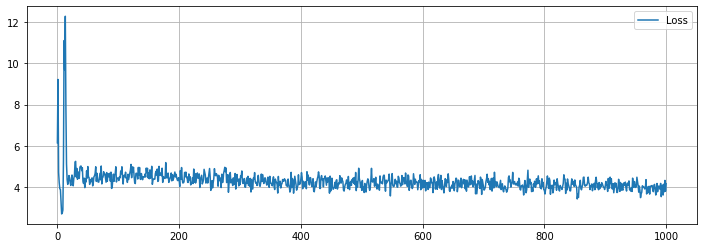
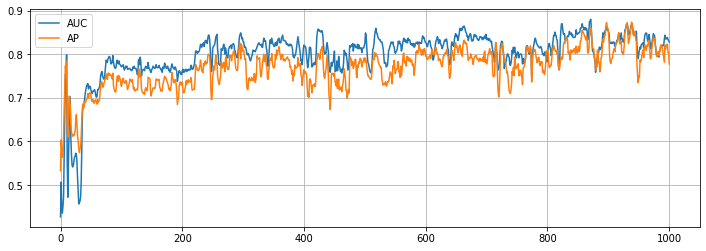
学習の履歴は次のようになりました。
import matplotlib.pyplot as plot

plt.figure(figsize=(12, 4))
plt.plot(loss_hist, label="Loss")
plt.grid()
plt.legend()
plt.show()
plt.figure(figsize=(12, 4))
plt.plot(auc_hist, label="AUC")
plt.plot(ap_hist, label="AP")
plt.grid()
plt.legend()
plt.show()
学習はできたので、次は(辺の)予測です。エンコーダーで算出した z を利用して、予測された隣接行列(っぽいもの)を算出します。
z = best_model.encode(data.x, data.train_pos_edge_index)
prob_adj = z @ z.T
prob_adj = prob_adj - torch.diagonal(prob_adj)
prob_adj
tensor([[ 0.0000, -0.1605, -2.9369,  ..., -2.1484, -0.8291, -0.9413],
        [-0.3042,  0.0000, -1.9366,  ..., -2.0792, -0.9268, -1.1541],
        [-0.7701,  0.3739,  0.0000,  ..., -2.0524, -1.2008, -1.6314],
        ...,
        [-0.6908, -0.4780, -2.7617,  ...,  0.0000,  0.0721, -0.7996],
        [-0.4960, -0.4500, -3.0346,  ..., -1.0523,  0.0000, -0.2943],
        [-0.3621, -0.4313, -3.2191,  ..., -1.6780, -0.0482,  0.0000]],
       grad_fn=<SubBackward0>)
この値が閾値以上の場合に「隣接する」と考えたいと思います。閾値 threshold は 0 でも良いかもしれませんが、今回はこのように算出してみました。
prob_adj_values = prob_adj.detach().cpu().numpy().flatten()
prob_adj_values.sort()
dataset = use_dataset()
threshold = prob_adj_values[-len(dataset.data.edge_attr)]
dataset.data.edge_index = (prob_adj >= threshold).nonzero(as_tuple=False).t()
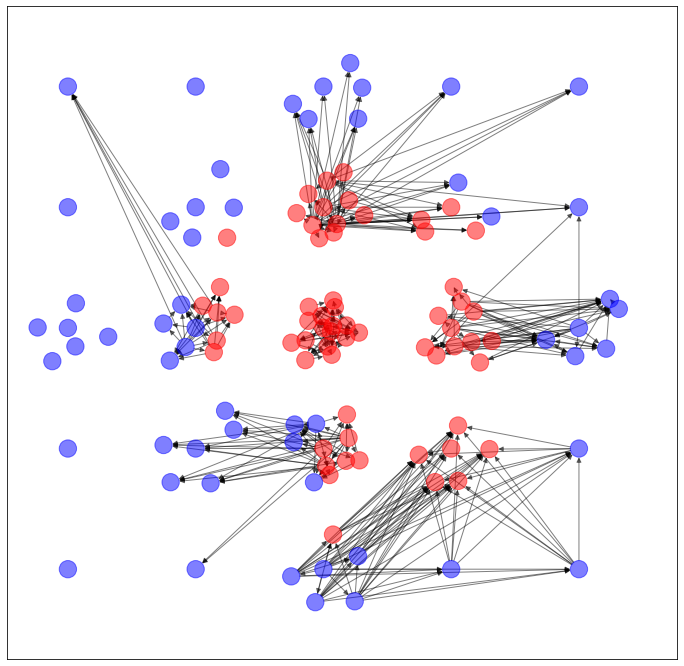
以上のように予測された辺を用いて、ネットワークを生成します。
import networkx as nx
import matplotlib.pyplot as plt

G = torch_geometric.utils.convert.to_networkx(dataset.data)
plt.figure(figsize=(12,12))
nx.draw_networkx(G, pos=dataset.layout(), with_labels=False, alpha=0.5, node_color=dataset.node_color())
うーん...過去記事のVGAEとかのほうがマシ...かな?微妙...
データセットを変える
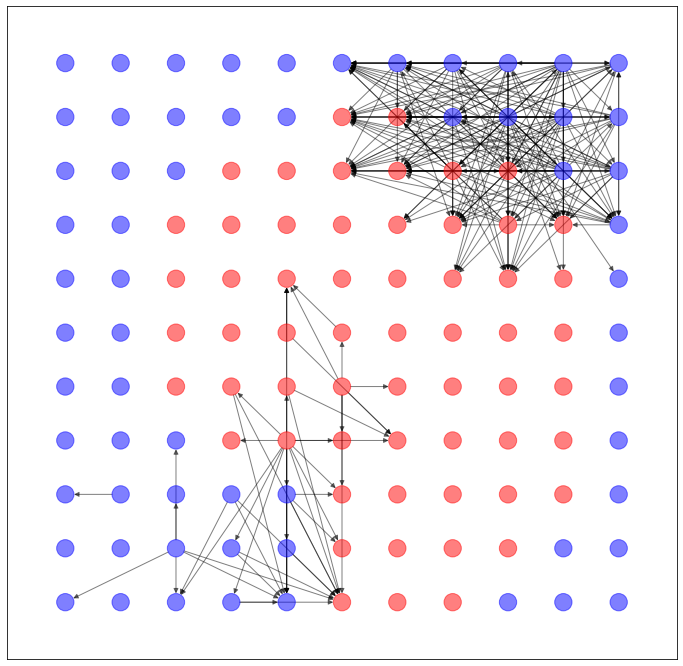
GridDatasetでも同様に計算してみました。
うーん、これも過去記事のVGAEとかのほうがマシな気がしますね...
