クラスターを生成する代表的手法としてk-meansがあります。これについては過去にも記事を書きましたが、今回は皆さんの勉強用に、 scikit-learnを使う方法と、使わない方法を併記したいと思います。
- K-meansクラスタリング(過去記事)
データの取得
機械学習の勉強用データとしてよく使われるあやめのデータを用います。
import urllib.request

url = "https://raw.githubusercontent.com/maskot1977/ipython_notebook/master/toydata/iris.txt"

filename = url.split("/")[-1]
urllib.request.urlretrieve(url, filename)
('iris.txt', <http.client.HTTPMessage at 0x7fac1779a470>)
import pandas as pd

df = pd.read_csv(filename, delimiter="\t", index_col=0)
df
| Sepal.Length | Sepal.Width | Petal.Length | Petal.Width | Species | |
|---|---|---|---|---|---|
| 1 | 5.1 | 3.5 | 1.4 | 0.2 | 0 |
| 2 | 4.9 | 3.0 | 1.4 | 0.2 | 0 |
| 3 | 4.7 | 3.2 | 1.3 | 0.2 | 0 |
| 4 | 4.6 | 3.1 | 1.5 | 0.2 | 0 |
| 5 | 5.0 | 3.6 | 1.4 | 0.2 | 0 |
| ... | ... | ... | ... | ... | ... |
| 146 | 6.7 | 3.0 | 5.2 | 2.3 | 2 |
| 147 | 6.3 | 2.5 | 5.0 | 1.9 | 2 |
| 148 | 6.5 | 3.0 | 5.2 | 2.0 | 2 |
| 149 | 6.2 | 3.4 | 5.4 | 2.3 | 2 |
| 150 | 5.9 | 3.0 | 5.1 | 1.8 | 2 |
150 rows × 5 columns
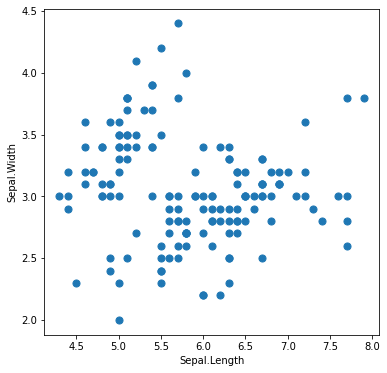
この中の左2列のデータだけを使ってみましょう。
%matplotlib inline
import matplotlib.pyplot as plt
import numpy as np

plt.figure(figsize=(6,6))
plt.scatter(df.iloc[:, 0], df.iloc[:, 1], s=50)
plt.xlabel(df.columns[0])
plt.ylabel(df.columns[1])
plt.show()
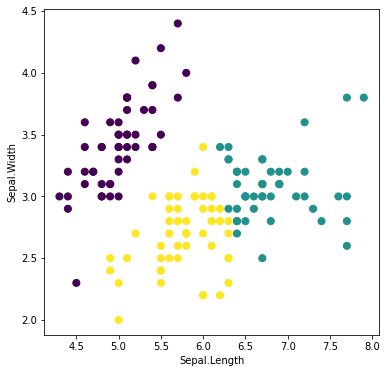
scikit-learn で k-means
機械学習用ライブラリとして有名なscikit-learnの中で、k-meansを行うモジュールはこちらになります。
k-meansでは、クラスターの数 n_clusters をあらかじめ指定しておく必要があります。
from sklearn.cluster import KMeans

kmeans_model = KMeans(n_clusters = 3).fit(df.iloc[:, :2])
たったこれだけで学習完了です。クラスタリング結果は次のようにして確認できます。
kmeans_model.labels_
array([0, 0, 0, 0, 0, 0, 0, 0, 0, 0, 0, 0, 0, 0, 0, 0, 0, 0, 0, 0, 0, 0,
       0, 0, 0, 0, 0, 0, 0, 0, 0, 0, 0, 0, 0, 0, 0, 0, 0, 0, 0, 0, 0, 0,
       0, 0, 0, 0, 0, 0, 1, 1, 1, 2, 1, 2, 1, 2, 1, 2, 2, 2, 2, 2, 2, 1,
       2, 2, 2, 2, 2, 2, 2, 2, 1, 1, 1, 1, 2, 2, 2, 2, 2, 2, 2, 2, 1, 2,
       2, 2, 2, 2, 2, 2, 2, 2, 2, 2, 2, 2, 1, 2, 1, 1, 1, 1, 2, 1, 1, 1,
       1, 1, 1, 2, 2, 1, 1, 1, 1, 2, 1, 2, 1, 2, 1, 1, 2, 2, 1, 1, 1, 1,
       1, 2, 2, 1, 1, 1, 2, 1, 1, 1, 2, 1, 1, 1, 2, 1, 1, 2], dtype=int32)
同じクラスターに属するサンプルは同じ色にして描画してみましょう。
%matplotlib inline
import matplotlib.pyplot as plt

plt.figure(figsize=(6,6))
plt.scatter(df.iloc[:, 0], df.iloc[:, 1], c=kmeans_model.labels_, s=50)
plt.xlabel(df.columns[0])
plt.ylabel(df.columns[1])
plt.show()
scikit-lean を使わず k-means
さて、意味が分からなくても使えるscikit-learnは大変便利なのですが、意味が分からずに使っていると、もしも何か間違った使い方をしてしまってもそれに気づかなかったり、結果の解釈を誤ってしまったりする恐れがあります。ですので、何が行われているか基礎を確認してみましょう。おおよそ次のような手順で計算が行われます。
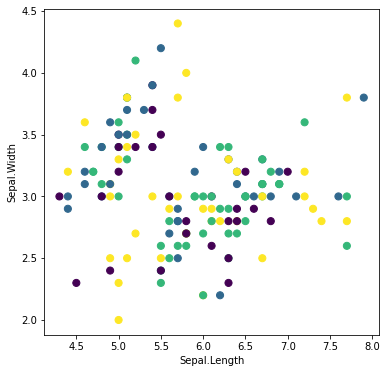
ランダムにラベルを与える
最終目標は、ラベルがクラスターを表すようにしたいのですが、最初はランダムから開始します。
import numpy as np

n_clusters = 3

df['labels'] = [np.random.randint(0, n_clusters) for x in range(len(df))]
df
| Sepal.Length | Sepal.Width | Petal.Length | Petal.Width | Species | labels | |
|---|---|---|---|---|---|---|
| 1 | 5.1 | 3.5 | 1.4 | 0.2 | 0 | 2 |
| 2 | 4.9 | 3.0 | 1.4 | 0.2 | 0 | 0 |
| 3 | 4.7 | 3.2 | 1.3 | 0.2 | 0 | 2 |
| 4 | 4.6 | 3.1 | 1.5 | 0.2 | 0 | 1 |
| 5 | 5.0 | 3.6 | 1.4 | 0.2 | 0 | 2 |
| ... | ... | ... | ... | ... | ... | ... |
| 146 | 6.7 | 3.0 | 5.2 | 2.3 | 2 | 0 |
| 147 | 6.3 | 2.5 | 5.0 | 1.9 | 2 | 0 |
| 148 | 6.5 | 3.0 | 5.2 | 2.0 | 2 | 2 |
| 149 | 6.2 | 3.4 | 5.4 | 2.3 | 2 | 2 |
| 150 | 5.9 | 3.0 | 5.1 | 1.8 | 2 | 2 |
150 rows × 6 columns
%matplotlib inline
import matplotlib.pyplot as plt

plt.figure(figsize=(6,6))
plt.scatter(df.iloc[:, 0], df.iloc[:, 1], c=df['labels'], s=50)
plt.xlabel(df.columns[0])
plt.ylabel(df.columns[1])
plt.show()
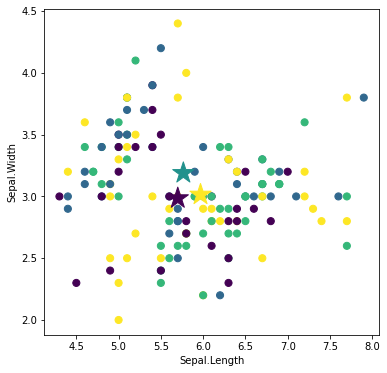
重心を求める
ラベルが与えられた集団ごとに、重心を求めます。
centroids = []
for i in range(n_clusters):
    df_mean = df[df['labels'] == i].mean()
    centroids.append([df_mean[0], df_mean[1]])

centroids
[[5.7, 2.9851851851851845],
 [5.765789473684211, 3.189473684210527],
 [5.968749999999999, 3.014583333333333]]
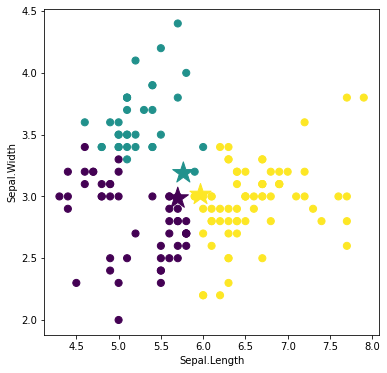
重心を星印で描画してみましょう。
%matplotlib inline
import matplotlib.pyplot as plt
import numpy as np

plt.figure(figsize=(6,6))
plt.scatter(df.iloc[:, 0], df.iloc[:, 1], c=df['labels'], s=50)
plt.scatter(np.array(centroids)[:, 0], np.array(centroids)[:, 1],
            c=range(n_clusters), marker='*', s=500)
plt.xlabel(df.columns[0])
plt.ylabel(df.columns[1])
plt.show()
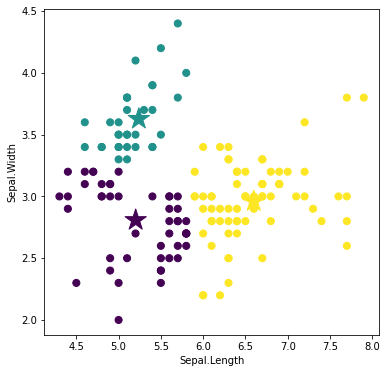
ラベルを再配分する
各サンプルごとに、最も近い重心を選び、その重心のラベルに基づいてラベルを再配分します。
def nearest_centroid(centroids, x, y):
    min_dist = False
    min_id = False
    for i, xy in enumerate(centroids):
        dist = (xy[0] - x)**2 + (xy[1] - y)**2
        if i == 0 or min_dist > dist:
            min_dist = dist
            min_id = i

    return min_id
df['labels'] = [
                nearest_centroid(
                    centroids,
                    df[df.columns[0]][x + 1],
                    df[df.columns[1]][x + 1]
                    ) for x in range(len(df))
                    ]
%matplotlib inline
import matplotlib.pyplot as plt
import numpy as np

plt.figure(figsize=(6,6))
plt.scatter(df.iloc[:, 0], df.iloc[:, 1], c=df['labels'], s=50)
plt.scatter(np.array(centroids)[:, 0], np.array(centroids)[:, 1],
            c=range(n_clusters), marker='*', s=500)
plt.xlabel(df.columns[0])
plt.ylabel(df.columns[1])
plt.show()
重心を求める
再配分されたラベルに基づいて、ラベルごとに重心を求めます。
centroids = []
for i in range(n_clusters):
    df_mean = df[df['labels'] == i].mean()
    centroids.append([df_mean[0], df_mean[1]])

centroids
[[5.20204081632653, 2.808163265306123],
 [5.239393939393939, 3.6272727272727274],
 [6.598529411764702, 2.9602941176470594]]
%matplotlib inline
import matplotlib.pyplot as plt
import numpy as np

plt.figure(figsize=(6,6))
plt.scatter(df.iloc[:, 0], df.iloc[:, 1], c=df['labels'], s=50)
plt.scatter(np.array(centroids)[:, 0], np.array(centroids)[:, 1],
            c=range(n_clusters), marker='*', s=500)
plt.xlabel(df.columns[0])
plt.ylabel(df.columns[1])
plt.show()

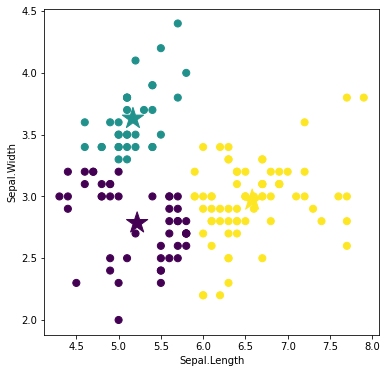
ラベルを再配分する
再計算された重心に基づいて、ラベルを再配分します。
df['labels'] = [
                nearest_centroid(
                    centroids,
                    df[df.columns[0]][x + 1],
                    df[df.columns[1]][x + 1]
                    ) for x in range(len(df))
                    ]
%matplotlib inline
import matplotlib.pyplot as plt
import numpy as np

plt.figure(figsize=(6,6))
plt.scatter(df.iloc[:, 0], df.iloc[:, 1], c=df['labels'], s=50)
plt.scatter(np.array(centroids)[:, 0], np.array(centroids)[:, 1],
            c=range(n_clusters), marker='*', s=500)
plt.xlabel(df.columns[0])
plt.ylabel(df.columns[1])
plt.show()
重心を求める
再配分されたラベルに基づいて、重心を再計算します。
centroids = []
for i in range(n_clusters):
    df_mean = df[df['labels'] == i].mean()
    centroids.append([df_mean[0], df_mean[1]])

centroids
[[5.219148936170212, 2.7851063829787237],
 [5.16969696969697, 3.6303030303030304],
 [6.579999999999997, 2.9700000000000006]]
%matplotlib inline
import matplotlib.pyplot as plt
import numpy as np

plt.figure(figsize=(6,6))
plt.scatter(df.iloc[:, 0], df.iloc[:, 1], c=df['labels'], s=50)
plt.scatter(np.array(centroids)[:, 0], np.array(centroids)[:, 1],
            c=range(n_clusters), marker='*', s=500)
plt.xlabel(df.columns[0])
plt.ylabel(df.columns[1])
plt.show()
ラベルを再配分する
再計算された重心に基づいて、ラベルを再配分します。
df['labels'] = [
                nearest_centroid(
                    centroids,
                    df[df.columns[0]][x + 1],
                    df[df.columns[1]][x + 1]
                    ) for x in range(len(df))
                    ]
%matplotlib inline
import matplotlib.pyplot as plt
import numpy as np

plt.figure(figsize=(6,6))
plt.scatter(df.iloc[:, 0], df.iloc[:, 1], c=df['labels'], s=50)
plt.scatter(np.array(centroids)[:, 0], np.array(centroids)[:, 1],
            c=range(n_clusters), marker='*', s=500)
plt.xlabel(df.columns[0])
plt.ylabel(df.columns[1])
plt.show()
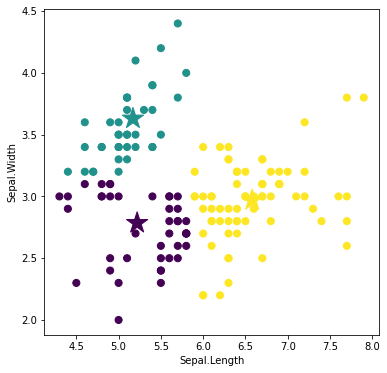
重心を求める
再配分されたラベルに基づいて、重心を再計算します。
centroids = []
for i in range(n_clusters):
    df_mean = df[df['labels'] == i].mean()
    centroids.append([df_mean[0], df_mean[1]])

centroids
[[5.283333333333333, 2.7357142857142853],
 [5.105263157894737, 3.573684210526316],
 [6.579999999999997, 2.9700000000000006]]
%matplotlib inline
import matplotlib.pyplot as plt
import numpy as np

plt.figure(figsize=(6,6))
plt.scatter(df.iloc[:, 0], df.iloc[:, 1], c=df['labels'], s=50)
plt.scatter(np.array(centroids)[:, 0], np.array(centroids)[:, 1],
            c=range(n_clusters), marker='*', s=500)
plt.xlabel(df.columns[0])
plt.ylabel(df.columns[1])
plt.show()

以上のように、計算が落ち着くまで繰り返します。
課題
上記の「scikit-learnを使わないコード」について、以下の課題に取り組んでください。
- 計算が落ち着くまで繰り返し計算ができるように、上記のコードを改良してください。
- クラスターの数を増やして、挙動を確認してください。
- 左2列だけでなく左4列を用いて実行してください。
- 上記のアルゴリズムでは、たとえば
n_clusters = 10にしても、最終的に得られるクラスターの数が10にならないときがあります。それはなぜか説明し、それを避けるためにはアルゴリズムをどう改変すれば良いか提案してください。