2016年に作った資料を公開します。もう既にいろいろ古くなってる可能性が高いです。
- 本実習では教師なし学習の一種であるK-meansクラスタリングを行ないます。
- K-means とは何か、知らない人は下記リンク参照↓
まずはサンプルデータの取得から
# URL によるリソースへのアクセスを提供するライブラリをインポートする。
import urllib
# ウェブ上のリソースを指定する
url = 'https://raw.githubusercontent.com/maskot1977/ipython_notebook/master/toydata/SchoolScore.txt'
# 指定したURLからリソースをダウンロードし、名前をつける。
urllib.urlretrieve(url, 'SchoolScore.txt')
('SchoolScore.txt', <httplib.HTTPMessage instance at 0x104143e18>)
import pandas as pd # データフレームワーク処理のライブラリをインポート
df = pd.read_csv("SchoolScore.txt", sep='\t', na_values=".") # データの読み込み
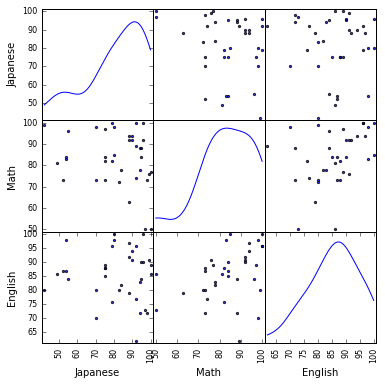
得られたデータを確認します。全体像も眺めます。
df.head() #データの確認
| Student | Japanese | Math | English | |
|---|---|---|---|---|
| 0 | 0 | 80 | 85 | 100 |
| 1 | 1 | 96 | 100 | 100 |
| 2 | 2 | 54 | 83 | 98 |
| 3 | 3 | 80 | 98 | 98 |
| 4 | 4 | 90 | 92 | 91 |
df.iloc[:, 1:].head() #解析に使うデータは2列目以降
| Japanese | Math | English | |
|---|---|---|---|
| 0 | 80 | 85 | 100 |
| 1 | 96 | 100 | 100 |
| 2 | 54 | 83 | 98 |
| 3 | 80 | 98 | 98 |
| 4 | 90 | 92 | 91 |
# 図やグラフを図示するためのライブラリをインポートする。
import matplotlib.pyplot as plt
%matplotlib inline
from pandas import plotting # 高度なプロットを行うツールのインポート
plotting.scatter_matrix(df[df.columns[1:]], figsize=(6,6), alpha=0.8, diagonal='kde')   #全体像を眺める
plt.show()
さていよいよ K-means クラスタリングの実行です。
- たくさんの学生を、合計点ではなく、国語・数学・英語の学力が似ている3クラスタに分類してクラス分けをしたいと思います。
from sklearn.cluster import KMeans # K-means クラスタリングをおこなう
# この例では 3 つのグループに分割 (メルセンヌツイスターの乱数の種を 10 とする)
kmeans_model = KMeans(n_clusters=3, random_state=10).fit(df.iloc[:, 1:])
# 分類結果のラベルを取得する
labels = kmeans_model.labels_
# 分類結果を確認
labels
array([2, 2, 0, 2, 2, 1, 2, 2, 1, 2, 2, 2, 1, 2, 2, 0, 1, 2, 0, 0, 1, 0, 1,
       1, 2, 2, 2, 0, 1, 1, 1, 1, 1, 1, 0, 1, 1], dtype=int32)
これでいちおう結果は得られました。ですが、これだけ見せられてもピンとこないので、結果を図示しましょう。
分類結果を図示する。
# それぞれに与える色を決める。
color_codes = {0:'#00FF00', 1:'#FF0000', 2:'#0000FF'}
# サンプル毎に色を与える。
colors = [color_codes[x] for x in labels]
# 色分けした Scatter Matrix を描く。
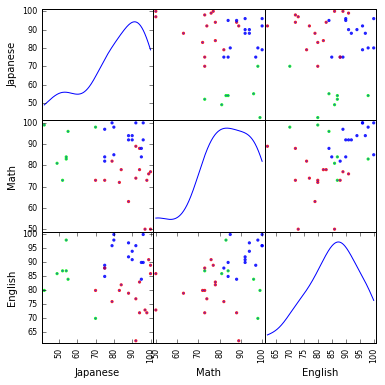
plotting.scatter_matrix(df[df.columns[1:]], figsize=(6,6), color=colors, alpha=0.8, diagonal='kde')   #データのプロット
plt.show()
いちおう色分けされました。なんとなく学力の似ているクラスタに分かれたような気がしますが、これでもまだピンとこないかもしれません。
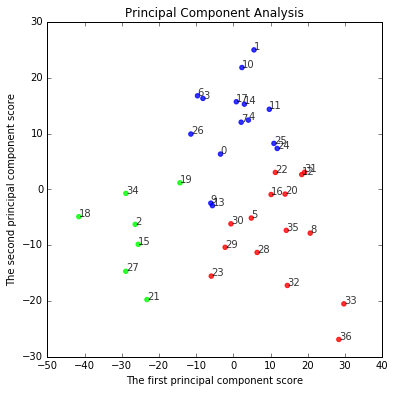
主成分分析をして、K-meansの結果をマッピングする。
#import sklearn #機械学習のライブラリ
from sklearn.decomposition import PCA #主成分分析器
#主成分分析の実行
pca = PCA()
pca.fit(df.iloc[:, 1:])
PCA(copy=True, n_components=None, whiten=False)
# データを主成分空間に写像 = 次元圧縮
feature = pca.transform(df.iloc[:, 1:])
# 第一主成分と第二主成分でプロットする
plt.figure(figsize=(6, 6))
for x, y, name in zip(feature[:, 0], feature[:, 1], df.iloc[:, 0]):
    plt.text(x, y, name, alpha=0.8, size=10)
plt.scatter(feature[:, 0], feature[:, 1], alpha=0.8, color=colors)
plt.title("Principal Component Analysis")
plt.xlabel("The first principal component score")
plt.ylabel("The second principal component score")
plt.show()
K-meansでどのように分かれたか、これで(さっきよりは)はっきり分かったかもしれません。
課題
新しいノートを開いて、以下の課題を解いてください。
-
課題1: 下記リンクのデータを用い、150個のアヤメをK-means法で3つのクラスタに分類してください。
https://raw.githubusercontent.com/maskot1977/ipython_notebook/master/toydata/iris.txt - 課題2: 分類結果を Scatter Matrix で確認してください。
- 課題3: 分類結果を主成分分析で確認してください。
- 課題4: クラスタ数を4つや5つなどに変更するとどうなるか確認してください。


