Firebase Analytics のイベントを BigQuery 経由で定期集計して
ダッシュボード化するというのを前回やりました:
👉 https://qiita.com/mangano-ito/items/5ed1e75f1779a364fa20
今回は集計したデータを Google Spreadsheet と Google Apps Script で
Slack にグラフ通知するというものをつくってみたいと思います。
流れ
- BigQuery から適当な日時の範囲のデータをとってくる
- スプレッドシートに (1) で取得したデータを書き込む
- シートに (2) のデータからグラフを作成する
- (3) のグラフ画像を取得する
- Slack にグラフ画像をアップロードする
という流れになります。
Slack
Slack 側では画像をアップロードするために
Slackbot を作成してトークンを取得しておきます:


ここで生成されたトークンを次の Google Apps Script での Slack 投稿に使用するのでメモしておきます。
名前やアイコンは好きなものを使うと愛着がわきます ![]()
Google Apps Script
気をつけておくのは、この GAS はスプレッドシートに紐付いていること前提だということです (Container-bound Script)。
なので適当なスプレッドシートを作成してから メニューバー > ツール > スクリプトエディタ で GAS を作成します。
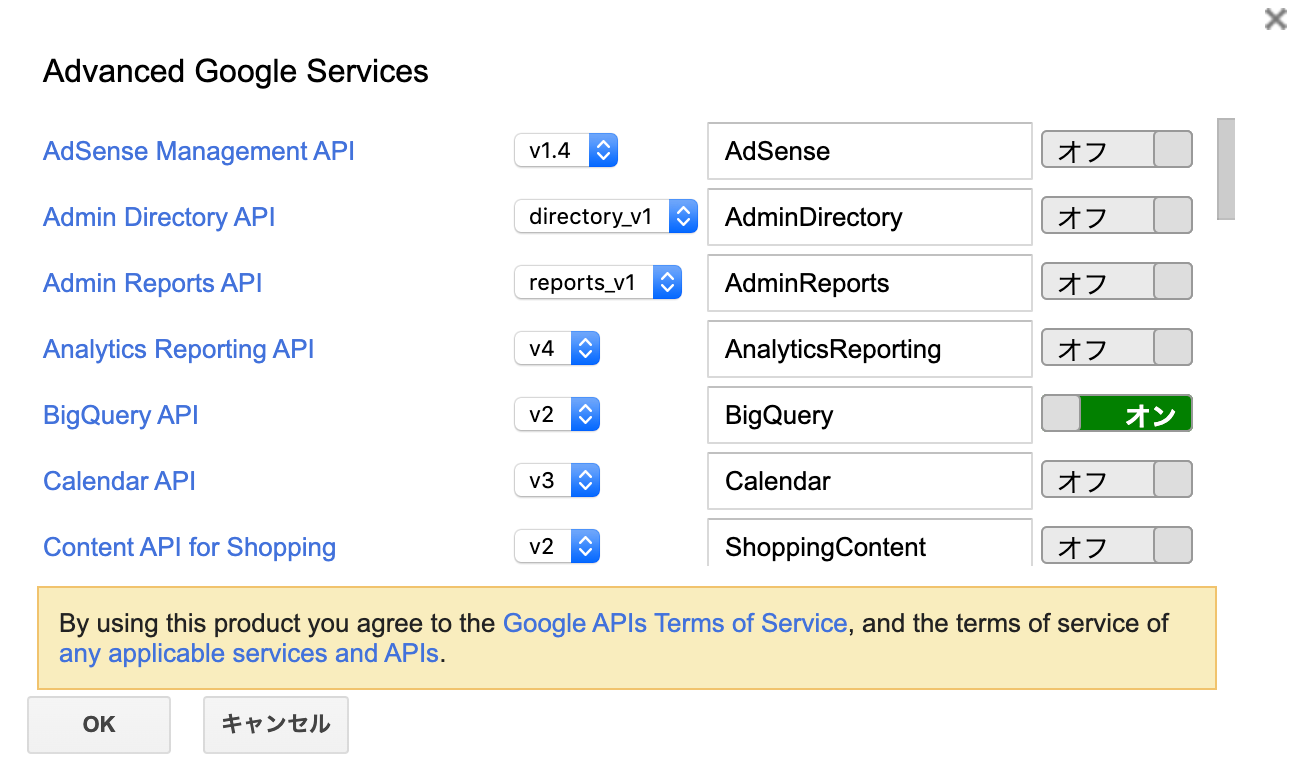
あらかじめ BigQuery API と Google Sheets API は GAS 側で許可しておきます
(メニューバー > リソース > Google の拡張サービス…):

実際のコードは以下になります。古めかしい書き方をしないといけないのが辛いところですが、処理ごとにファイルに分けてます。それぞれを新規ファイルでコピペ追加すれば OK です。
まず BigQuery のテーブルからまるっと列をとってくるクラスです:
/**
 * @class
 */
var Report = (function () {
    /** @typedef {any[]} Row */
    /** @typedef {Row} Header */
    /** @typedef {Row[]} Rows */
    /** @typedef {{request: string}} Request */

    /**
     * SQL to fetch report data
     * @const {string}
     */
    var REPORT_QUERY = [
        '#standardSQL ',
        'SELECT     * ',
        '  FROM     `%s` ',
        '  WHERE    _TABLE_SUFFIX BETWEEN "%s" AND "%s" ',
        '  ORDER BY event_date ASC ',
    ].join('\n');

    /**
     * @constructor
     * @param {string} projectId GCP Project ID
     * @param {string} table     Name of Table
     * @param {Date}   from      first date of range
     * @param {Date}   to        end date of range
     */
    function Report(projectId, table, from, to) {
        this.projectId = projectId;
        this.table     = table;
        this.from      = from;
        this.to        = to;

        this.header   = null;
        this.rows     = null;
        this.complete = false;
    }

    /**
     * make `Date` into `string`
     *
     * @param {Date} date `Date` to format into `string`
     * @returns {string} `date` as `string`
     */
    function intoDateString(date) {
        return Utilities.formatDate(date, 'JST', 'yyyyMMdd');
    }

    /**
     * make BigQuery rows into `Array`
     *
     * @param {*} rows BigQuery rows
     * @returns {Rows} rows as `Array`
     */
    function intoArray(rows) {
        return rows.map(function (row) {
            return row.getF().map(function (col) {
                return col.getV();
            });
        });
    }

    /**
     * make BigQuery request
     *
     * @this Report
     * @private
     *
     * @returns {Request} request object
     */
    Report.prototype._makeRequest = function () {
        var from    = intoDateString(this.from);
        var to      = intoDateString(this.to);
        var query   = Utilities.formatString(REPORT_QUERY, this.table, from, to);
        var request = {'query': query};

        return request;
    }

    /**
     * await BigQuery query result (synchronously)
     *
     * @this Report
     * @private
     *
     * @param {Request} request BigQuery request
     * @returns {*} BigQuery query result (completed)
     */
    Report.prototype._awaitResult = function (request) {
        var result = BigQuery.Jobs.query(request, this.projectId)
        var jobId  = result.jobReference.jobId;
        while (!result.jobComplete) {
            Utilities.sleep(500);
            result = BigQuery.Jobs.getQueryResults(this.projectId, jobId);
        }

        return result;
    };

    /**
     * fetch BigQuery result rows
     *
     * @this Report
     * @private
     *
     * @param {*} result BigQuery result
     * @returns {Rows} BigQuery rows
     */
    Report.prototype._fetchRows = function (result) {
        var jobId = result.jobReference.jobId;
        var rows  = result.getRows();
        while (result.pageToken) {
            result = BigQuery.Jobs.getQueryResults(this.projectId, jobId, {
                pageToken: result.pageToken
            });
            rows = rows.concat(result.getRows());
        }

        return rows;
    };

    /**
     * wait for query result and fetch rows
     *
     * @this Report
     * @private
     *
     * @param {Request} request BigQuery request
     * @param {*} result BigQuery query result object
     */
    Report.prototype._fetch = function (request) {
        var result  = this._awaitResult(request);
        this.rows   = intoArray(this._fetchRows(result));
        this.header = result.getSchema().getFields().map(function (field) {
            return field.getName();
        });
    };

    /**
     * query report to BigQuery
     *
     * @this Report
     * @private
     *
     * @param {Date} from first date of data range
     * @param {Date} to   end date of data range
     */
    Report.prototype._query = function () {
        if (this.complete) {
            return;
        }
        var request = this._makeRequest();
        this._fetch(request);
        this.complete = true;
    };

    /**
     * @this Report
     * @returns {Header} a header row
     */
    Report.prototype.getHeader = function () {
        this._query();

        return this.header || [];
    };

    /**
     * @this Report
     * @returns {Rows} rows
     */
    Report.prototype.getRows = function () {
        this._query();

        return this.rows || [];
    };

    return Report;
})();
スプレッドシートにデータを書き込んで、画像を取得するクラスです:
/**
 * @class
 */
var Sheet = (function () {
    /**
     * @constructor
     * @param {string} sheetName name of sheet to store data in
     */
    function Sheet(sheetName) {
        this.sheets = SpreadsheetApp.getActiveSpreadsheet();
        this.sheet  = this.sheets.getSheetByName(sheetName);
    }

    /**
     * put rows to spreadsheet
     *
     * @this Sheet
     *
     * @param {any[]} header a header row
     * @param {any[][]} rows rows to put
     * @returns {this} this
     */
    Sheet.prototype.put = function (header, rows) {
        this.sheet
            .getRange(1, 1, rows.length + 1, header.length)
            .setValues([header].concat(rows));

        return this;
    };

    /**
     * make chart image in Spreadsheet into blob
     *
     * @this Sheet
     *
     * @param {number} index index of chart in the sheet
     * @returns {Blob} chart image blob
     */
    Sheet.prototype.fetchChart = function (index) {
        var charts = this.sheet.getCharts();
        var chart  = charts[index];
        var name   = 'chart' + index + '.png';
        var blob   = chart.getBlob().getAs('image/png').setName(name);

        return blob;
    };

    return Sheet;
})();
Slack に投稿するクラスです:
/**
 * @class
 */
var Slack = (function () {
    /**
     * Slack Post API Endpoint
     * @const {string}
     */
    var SLACK_API_POST = 'https://slack.com/api/files.upload';

    /**
     * @constructor
     * @param {string} token Slack API Token
     */
    function Slack(token) {
        this.token = token;
    }

    /**
     * upload an image to Slack
     *
     * @this Slack
     *
     * @param {string} channel  channel name to post in
     * @param {Blob}   file     file as blob to post
     * @param {string} filename name of file
     */
    Slack.prototype.upload = function (channel, file, filename) {
        var options = {
            method:  'post',
            payload: {
                'token':    this.token,
                'file':     file,
                'filename': filename,
                'channels': channel,
            },
        };
        UrlFetchApp.fetch(SLACK_API_POST, options);
    }

    return Slack;
})();
日付の範囲を生成するだけのクラスです:
/**
 * @class
 */
var DateDuration = (function () {
    /**
     * @constructor
     * @param {number} duration duration in days
     */
    function DateDuration(duration) {
        this.from = new Date();
        this.to   = new Date();
        this.from.setDate(this.from.getDate() - duration - 1);
        this.to.setDate(this.from.getDate() + duration);
    };

    /**
     * @returns {Date} start date of duration range
     */
    DateDuration.prototype.getStart = function () {
        return this.from;
    };

    /**
     * @returns {Date} end date of duration range
     */
    DateDuration.prototype.getEnd = function () {
        return this.to;
    };

    return DateDuration;
})();
以上をまとめて全体の処理を記述します:
/**
 * @const
 */
var CONFIG = {
    /** GCP Project ID */
    projectId: '<あなたの Project ID>',
    /** Slack API Token */
    slackToken: '<あなたの Slack トークン>',
    /** Slack Channel Name to post messages in */
    slackPostChannel: '<投稿する Slack チャンネル>',
    /** Name of Report Table */
    table: '<BigQuery テーブル名; 例: firebase_analytics_report.daily_reports_*>',
    /** Name of Sheet */
    sheetName: '<スプレッドシートの作成済みのデータ記録用のシート名>',
    /** Index of Chart in the Sheet */
    sheetChartIndex: <シート内のグラフの番号 (作成順)>,
    /** Duration of report in days */
    duration: 14,
};

function main() {
    var range  = new DateDuration(CONFIG.duration);
    var report = new Report(CONFIG.projectId, CONFIG.table, range.getStart(), range.getEnd());
    var sheet  = new SheetStore(CONFIG.sheetName);
    var image  = sheet
        .put(report.getHeader(), report.getRows())
        .fetchChart(CONFIG.sheetChartIndex);
    var slack = new Slack(CONFIG.slackToken);
    slack.upload(CONFIG.slackPostChannel, image, 'screenviews.png');
}
CONFIG は自分の環境の値を入れておけば OK です:

これを GAS の定期実行を組んでおけば
毎日定時に自動で Slack に KPI を通知することができます。
Spreadsheet
シート側では取得したデータを可視化するグラフを作成します。
これは通常のグラフの操作を同じ感じで
自分の好きなフォーマットで作成すれば OK です。
GAS でそのまま書き出したデータのテーブルはこうなっています:

グラフ側で集計すると画像がうまく生成されないので、
シート側でプラットホームをまとめて集計した表を View っぽく作っておきます:

こうすれば両プラットホームをまとめた KPI をグラフにできます:

先週比
あるいは 今週 対 先週 という週間の比較をする場合は、
少しだけ計算を工夫した View を作っておけば、
比較したグラフを作成できます:

まず、直近の月曜を R19 に = TODAY() - WEEKDAY(TODAY(), 3) - 7 として求めておきます:

先週と今週の日にちを R3 から順に R19 - 7 〜 R19 + 6 して計算して R3:R9, R11:R17 の列に入れます:

すると S3 から順に = VLOOKUP(R3, H2:M16, 3, FALSE) を使うことで、上で集約しておいた表を使って求めることができます。これで S3:S9, S11:S17 には先週と今週の KPI が求まります:

全体像はこうなります:

直接データを加工するのではなくシート側で射影を作成していますが、
BigQuery 側であらかじめ加工しておいたほうがいいケースもあるので
そこらへんも工夫できそうです。
変更 & ウォッチしやすいようにデータとグラフを工夫してつくるのがいいですね。
結果
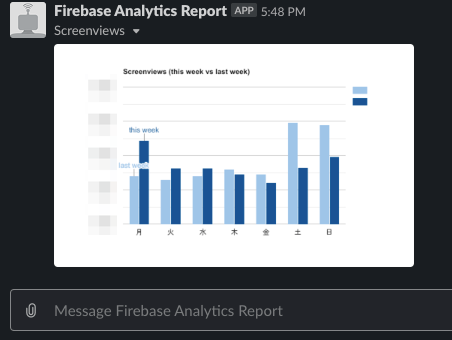
このように Slack に通知されます:
![]()
Slack Workflow と合わせたりすると数値を追うことがより楽になったりするかもしれません。

