参考記事
公式にもサンプルコードあり
準備 CDN
chart.php
<script src="https://cdnjs.cloudflare.com/ajax/libs/Chart.js/2.9.3/Chart.bundle.min.js"></script>
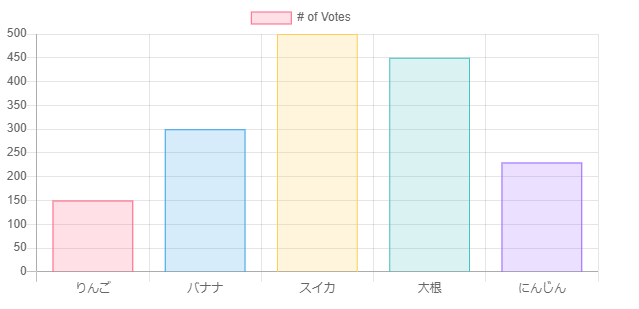
テストコード
DB接続なしの試しのコード。
グラフを表示したい箇所に記述。cssで大きさを調節。
chart.php
<div style="width:600px">
  <canvas id="myChart"></canvas>
</div>
chart.php
 <script>
    var ctx = document.getElementById('myChart').getContext('2d');
    var myChart = new Chart(ctx, {
        type: 'bar',
        data: {
            //横軸のラベル名
            labels: ['りんご', 'バナナ', 'スイカ', '大根', 'にんじん'],
            datasets: [{
                label: '# of Votes',
            //縦軸のラベル(値)
                data: [150, 300, 700, 450, 230],
                backgroundColor: [
                    'rgba(255, 99, 132, 0.2)',
                    'rgba(54, 162, 235, 0.2)',
                    'rgba(255, 206, 86, 0.2)',
                    'rgba(75, 192, 192, 0.2)',
                    'rgba(153, 102, 255, 0.2)',
                    'rgba(255, 159, 64, 0.2)'
                ],
                borderColor: [
                    'rgba(255, 99, 132, 1)',
                    'rgba(54, 162, 235, 1)',
                    'rgba(255, 206, 86, 1)',
                    'rgba(75, 192, 192, 1)',
                    'rgba(153, 102, 255, 1)',
                    'rgba(255, 159, 64, 1)'
                ],
                borderWidth: 1
            }]
        },
        options: {
            scales: {
                yAxes: [{
                    ticks: {
                        beginAtZero: true
                    }
                }]
            }
        }
    });
    </script>
DB接続ありのコード
テストコードを書き替えていく。
DB接続専用ファイルを用意
function.php
// DBに接続
function dbconnect() {
    $db = new mysqli('localhost', 'root', 'root', 'recipe_site');
    if (!$db) {
        die($db->error);
    }
    return $db;
}
chart.phpでfunction.phpを呼び出し&DBに接続
chart.php
<?php
require('./function.php');
$db = dbconnect();
?>
SQL文で取得した値を配列に入れる。
配列の中身を見る場合はprint_r関数などを使用。
chart.php
$stmt = $db->prepare("SELECT name, price FROM tests");
$status = $stmt->execute();
$stmt->bind_result($name, $price);

while ($stmt->fetch()) {
    $nameHoge[] = '"'. $name.'",';
    $priceHoge[] = '"'. $price .'",';
}
配列にした値をimplode関数を使用して文字列に変換する。
chart.php
    <script>
    var ctx = document.getElementById('myChart').getContext('2d');
    var myChart = new Chart(ctx, {
        type: 'bar',
        data: {
            labels: [<?php echo(implode($nameHoge)); ?>],
            datasets: [{
                label: '# of Votes',
                data: [<?php echo(implode($priceHoge)); ?>],
                backgroundColor: [
                    'rgba(255, 99, 132, 0.2)',
                    'rgba(54, 162, 235, 0.2)',
                    'rgba(255, 206, 86, 0.2)',
                    'rgba(75, 192, 192, 0.2)',
                    'rgba(153, 102, 255, 0.2)',
                    'rgba(255, 159, 64, 0.2)'
                ],
                borderColor: [
                    'rgba(255, 99, 132, 1)',
                    'rgba(54, 162, 235, 1)',
                    'rgba(255, 206, 86, 1)',
                    'rgba(75, 192, 192, 1)',
                    'rgba(153, 102, 255, 1)',
                    'rgba(255, 159, 64, 1)'
                ],
                borderWidth: 1
            }]
        },
        options: {
            scales: {
                yAxes: [{
                    ticks: {
                        beginAtZero: true
                    }
                }]
            }
        }
    });
    </script>
フルコード
function.php
// DBに接続
function dbconnect() {
    $db = new mysqli('localhost', 'root', 'root', 'recipe_site');
    if (!$db) {
        die($db->error);
    }
    return $db;
}
chart.php
require('./function.php');
$db = dbconnect();

$stmt = $db->prepare("SELECT name, price FROM tests");
$status = $stmt->execute();
$stmt->bind_result($name, $price);

while ($stmt->fetch()) {
    $nameHoge[] = '"'. $name.'",';
    $priceHoge[] = '"'. $price .'",';
}


print_r($nameHoge);
echo(implode($nameHoge));

print_r($priceHoge);
echo(implode($priceHoge));

?>
<!DOCTYPE html>
<html lang="en">
<head>
    <meta charset="UTF-8">
    <meta name="viewport" content="width=device-width, initial-scale=1.0">
    <title>Document</title>
</head>
<body>
<div style="width:600px">
  <canvas id="myChart"></canvas>
</div>

    <script src="https://cdnjs.cloudflare.com/ajax/libs/Chart.js/2.9.3/Chart.bundle.min.js"></script>
    <script>
    var ctx = document.getElementById('myChart').getContext('2d');
    var myChart = new Chart(ctx, {
        type: 'bar',
        data: {

            labels: [<?php echo(implode($nameHoge)); ?>],
            datasets: [{
                label: '# of Votes',
                data: [<?php echo(implode($priceHoge)); ?>],
                backgroundColor: [
                    'rgba(255, 99, 132, 0.2)',
                    'rgba(54, 162, 235, 0.2)',
                    'rgba(255, 206, 86, 0.2)',
                    'rgba(75, 192, 192, 0.2)',
                    'rgba(153, 102, 255, 0.2)',
                    'rgba(255, 159, 64, 0.2)'
                ],
                borderColor: [
                    'rgba(255, 99, 132, 1)',
                    'rgba(54, 162, 235, 1)',
                    'rgba(255, 206, 86, 1)',
                    'rgba(75, 192, 192, 1)',
                    'rgba(153, 102, 255, 1)',
                    'rgba(255, 159, 64, 1)'
                ],
                borderWidth: 1
            }]
        },
        options: {
            scales: {
                yAxes: [{
                    ticks: {
                        beginAtZero: true
                    }
                }]
            }
        }
    });
    </script>
</body>
</html>