kerasで1epochごとに各クラスのprecision,recall,f1のグラフを描画する
kerasのmetricで[Keras] クラスごとのAccuracy, Precision, Recall, F-measureをmetricsを利用してTensorBoardで確認するを参考にしてたら、batch_sizeごとの計算になるせいで全然値が違って困ったので、毎エポック終了時に計算するCallbackを書きました。
MetricHistoryクラスを定義します。
import pandas as pd
import numpy as np
import matplotlib.pyplot as plt
from keras.callbacks import Callback
from sklearn.metrics import classification_report
class MetricHistory(Callback):
    def __init__(self, model, X_train, y_train, X_test=None, y_test=None, labels=None, verbose=False):
        self.model = model
        self.X_train = X_train
        self.y_train = y_train
        self.X_test = X_test
        self.y_test = y_test
        self.verbose = verbose
        if labels is not None:
            self.nb_classes = len(labels)
            self.labels = labels
        else:
            self.nb_classes = len(np.unique(np.append(y_train, y_test)))
            self.labels = [str(i) for i in range(self.nb_classes)]
        self.history = {}
        self.metrics = []
        for i in range(self.nb_classes):
            for key in ["precision", "val_precision", "recall", "val_recall", "f1-score", "val_f1-score"]:
                if self.X_test is None and "val_" in key:
                    continue
                self.metrics.append("{}-{}".format(key, self.labels[i]))
        for key in ["precision", "val_precision", "recall", "val_recall", "f1-score", "val_f1-score"]:
            if self.X_test is None and "val_" in key:
                continue
            for avgclass in ["micro", "macro"]:
                self.metrics.append("{}-{}".format(key, avgclass))
        for metric in self.metrics:
            self.history[metric] = []

    def my_round(self, val, digit=0):
        p = 10 ** digit
        return (val * p * 2 + 1) // 2 / p

    def on_epoch_end(self, epoch, logs=None):
        if self.X_test is not None:
            y_pred = np.argmax(self.model.predict(self.X_test), axis=1)
            report =  classification_report(np.argmax(self.y_test, axis=1), y_pred, output_dict=True)
        y_pred_train = np.argmax(self.model.predict(self.X_train), axis=1)
        print(self.X_train.shape, np.argmax(self.y_train, axis=1).shape, y_pred_train.shape)
        report_train =  classification_report(np.argmax(self.y_train, axis=1), y_pred_train, output_dict=True)

        for key in ["precision", "recall", "f1-score"]:
            for i in range(self.nb_classes):
                keyclass = "{}-{}".format(key, self.labels[i])
                keyclassval = "val_{}-{}".format(key, self.labels[i])
                if str(i) in report_train:
                    self.history[keyclass].append(report_train[str(i)][key])
                else:
                    self.history[keyclass].append(0)
                if self.X_test is not None:
                    if str(i) in report:
                        self.history[keyclassval].append(report[str(i)][key])
                    else:
                        self.history[keyclassval].append(0)
        for key in ["precision", "recall", "f1-score"]:
            for avgclass in ["micro", "macro"]:
                keyclass= key + "-" + avgclass
                self.history[keyclass].append(report_train[avgclass+" avg"][key])
                if self.X_test is not None:
                    keyclassval= "val_" + keyclass
                    self.history[keyclassval].append(report[avgclass+" avg"][key])
        if self.verbose:
            line = []
            for label in self.metrics:
                line.append("{}: {}".format(label, self.my_round(self.history[label][-1], 4)))
            print(" - ", " - ".join(line))
trainするよ。MetricHistoryのインスタンスは後で参照するからコールバックの外で定義します。X_val, y_val, labelsは省略可能。
labels = ["T-shirt/top",
            "Trouser",
            "Pullover",
            "Dress",
            "Coat",
            "Sandal",
            "Shirt",
            "Sneaker",
            "Bag",
            "Ankle boot",]
metric = MetricHistory(model, X_train, y_train, X_val, y_val, labels, verbose=True)
callbacks = [
             metric,
            ]

train_model = model.fit(X_train, y_train,
                  batch_size=BATCH_SIZE,
                  epochs=NO_EPOCHS,
                  verbose=1,
                  validation_data=(X_val, y_val),
                  callbacks=callbacks)
Train実行。verbose=Trueだとエポックごとにログに出してくれます。
46592/48000 [============================>.] - ETA: 0s - loss: 0.0293 - acc: 0.9895(48000, 28, 28, 1) (48000,) (48000,)
-  precision-T-shirt/top: 0.9994 - val_precision-T-shirt/top: 0.8858 - recall-T-shirt/top: 0.9975 - val_recall-T-shirt/top: 0.8333 - f1-score-T-shirt/top: 0.9984 - val_f1-score-T-shirt/top: 0.8587 - precision-Trouser: 0.9998 - val_precision-Trouser: 0.9904 - recall-Trouser: 1.0 - val_recall-Trouser: 0.9825 - f1-score-Trouser: 0.9999 - val_f1-score-Trouser: 0.9864 - precision-Pullover: 0.9979 - val_precision-Pullover: 0.8628 - recall-Pullover: 0.9971 - val_recall-Pullover: 0.8857 - f1-score-Pullover: 0.9975 - val_f1-score-Pullover: 0.8741 - precision-Dress: 0.9959 - val_precision-Dress: 0.8741 - recall-Dress: 0.999 - val_recall-Dress: 0.9143 - f1-score-Dress: 0.9974 - val_f1-score-Dress: 0.8938 - precision-Coat: 0.9979 - val_precision-Coat: 0.8702 - recall-Coat: 0.9944 - val_recall-Coat: 0.863 - f1-score-Coat: 0.9961 - val_f1-score-Coat: 0.8666 - precision-Sandal: 0.9998 - val_precision-Sandal: 0.9816 - recall-Sandal: 0.9998 - val_recall-Sandal: 0.979 - f1-score-Sandal: 0.9998 - val_f1-score-Sandal: 0.9803 - precision-Shirt: 0.9952 - val_precision-Shirt: 0.7656 - recall-Shirt: 0.9973 - val_recall-Shirt: 0.7543 - f1-score-Shirt: 0.9962 - val_f1-score-Shirt: 0.7599 - precision-Sneaker: 0.9996 - val_precision-Sneaker: 0.9622 - recall-Sneaker: 0.9992 - val_recall-Sneaker: 0.9742 - f1-score-Sneaker: 0.9994 - val_f1-score-Sneaker: 0.9682 - precision-Bag: 0.9985 - val_precision-Bag: 0.9608 - recall-Bag: 0.9998 - val_recall-Bag: 0.9855 - f1-score-Bag: 0.9992 - val_f1-score-Bag: 0.973 - precision-Ankle boot: 0.9998 - val_precision-Ankle boot: 0.9716 - recall-Ankle boot: 0.9998 - val_recall-Ankle boot: 0.9616 - f1-score-Ankle boot: 0.9998 - val_f1-score-Ankle boot: 0.9666 - precision-micro: 0.9984 - precision-macro: 0.9984 - val_precision-micro: 0.9128 - val_precision-macro: 0.9125 - recall-micro: 0.9984 - recall-macro: 0.9984 - val_recall-micro: 0.9128 - val_recall-macro: 0.9134 - f1-score-micro: 0.9984 - f1-score-macro: 0.9984 - val_f1-score-micro: 0.9128 - val_f1-score-macro: 0.9128
def plot_history(label, metric, ax, val=True):
ax.plot(metric.history[label],label="{} for train".format(label), color="blue")
val_label = "val_" + label
if val and val_label in metric.history:
lmax = np.argmax(metric.history[val_label])
lmin = np.argmin(metric.history[val_label])
ax.plot(metric.history[val_label],label="{} for valid".format(label), color="orange")
ax.scatter([lmax, lmin], [metric.history[val_label][lmax], metric.history[val_label][lmin]], color="orange")
ax.set_title(label+ ' (val_min:{}, val_max:{})'.format(lmin, lmax))
ax.set_xlabel('epoch')
ax.set_ylabel(label)
ax.legend(loc='best')
nrows = len(labels)+3
fig, ax = plt.subplots(nrows=nrows, ncols=3, figsize=(15,6*nrows))
plot_history("loss", train_model, ax[0, 0])
plot_history("acc", train_model, ax[0, 1])
print(ax.shape)
for i, label in enumerate(labels):
for j, key in enumerate(["precision", "recall", "f1-score"]):
plot_history(key+"-"+label, metric, ax[i+1, j])
for i, avgclass in enumerate(["micro", "macro"]):
for j, key in enumerate(["precision", "recall", "f1-score"]):
plot_history(key+"-"+avgclass, metric, ax[11+i, j])
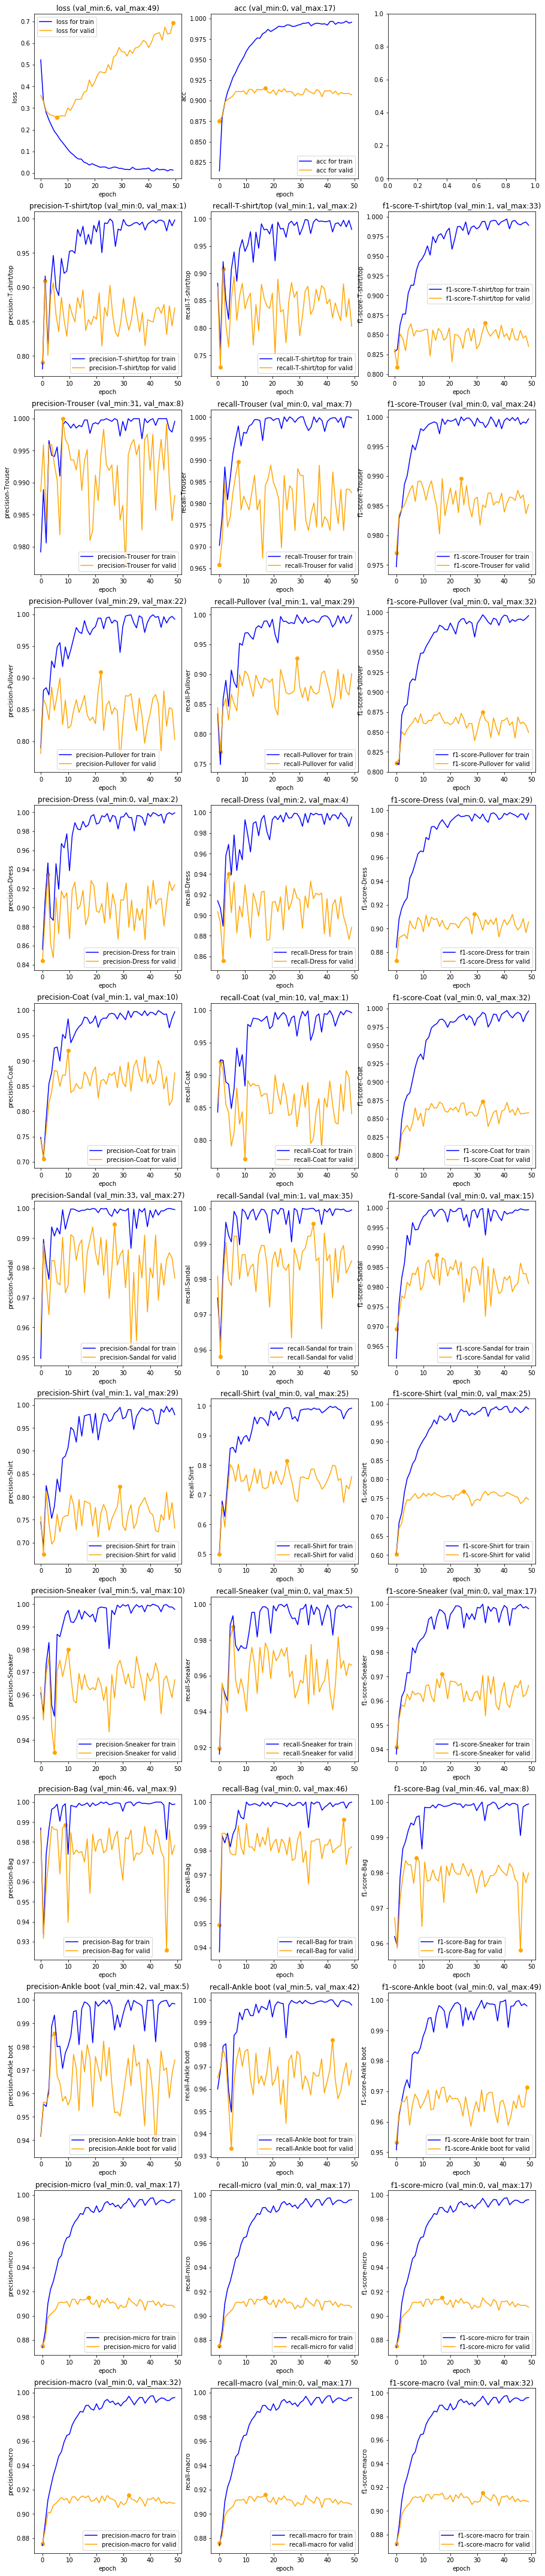
plt.show()
グラフ描画します。kerasではデフォルトでtrain_model.historyにログが入っているから、それに合わせてmetric.historyにログが入るようにしました。
val_系はminとmaxにマーカーが付いて、タイトルに(val_min: n, val_max: n)を出すようにしました。
ちなみに、kerasのModelCheckpointは1始まりだから全エポックを保存したモデルをload_weightsするときはn+1したモデルを読まないとだめみたい。
1番上がlossとaccuracy。真ん中が各クラスのprecition, recall, f1-score。一番下の2行がmicroとmacroだよ。クラス不均衡だとmacro知りたいからね。
X_train, y_train, X_test, y_testがメモリに乗っていることが前提なので、fit_generatorみたいな逐次読み込みには非対応です。
クラス不均衡怖いですね。どんどんグラフ化していきましょう。