追記
一部記載ミスがあり補足 & 修正済みです。すみません・・
はじめに
laravelのREPLであるTinkerですが、呼び出す際に下記のようにphpスクリプトを渡してあげると
そいつを実行してくれます。
php artisan script.php
これが色々な処理を手軽に実行できて便利なのですが、
実行時のデバッグがphpstormで簡単にできるので共有します。
(もちろんIntelliJでもできます)
前提
- ローカルのPHPでxdebugが設定済みであること
やり方
-
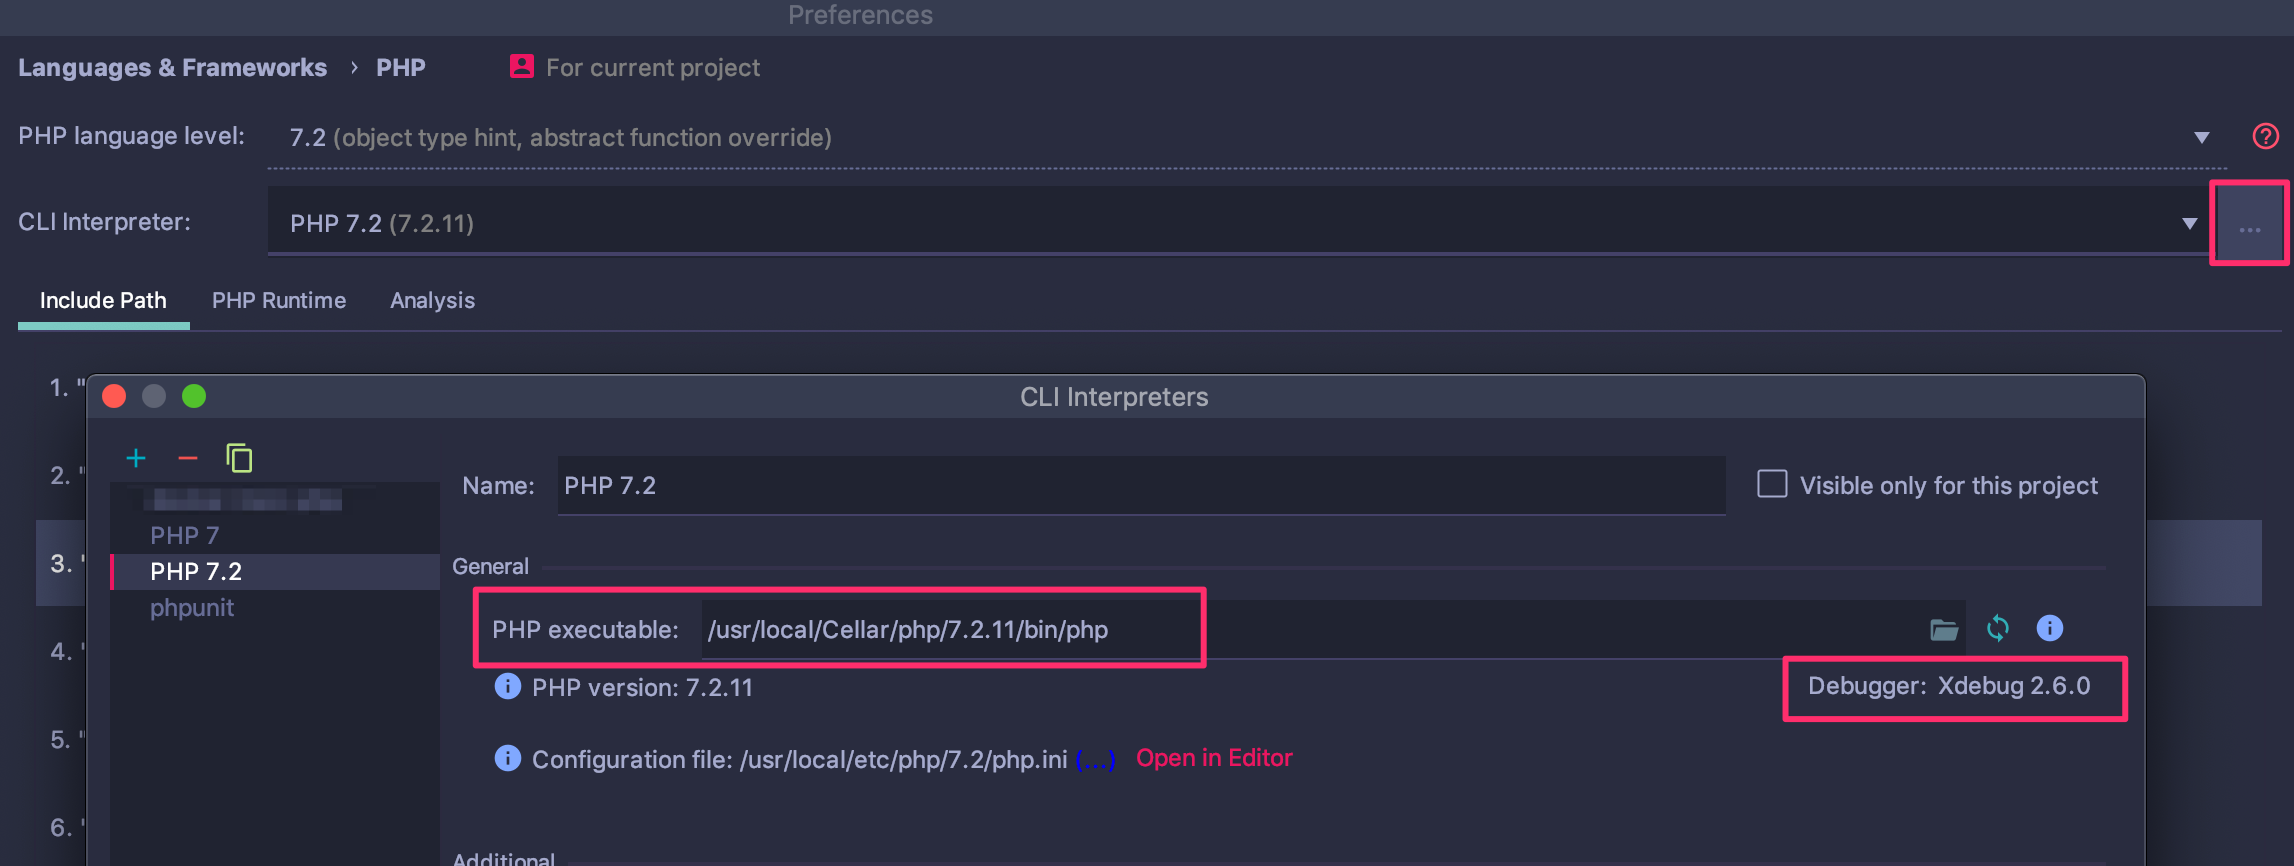
Preference > Language & Frameworks > PHPから、ローカルのPHPを指定し、xdebugが有効になっている必要があります。
- Phpstormのメニューバー上部のあたりから
Edit Configurations...を押し、
Run/Debug Configurationを開きます

-
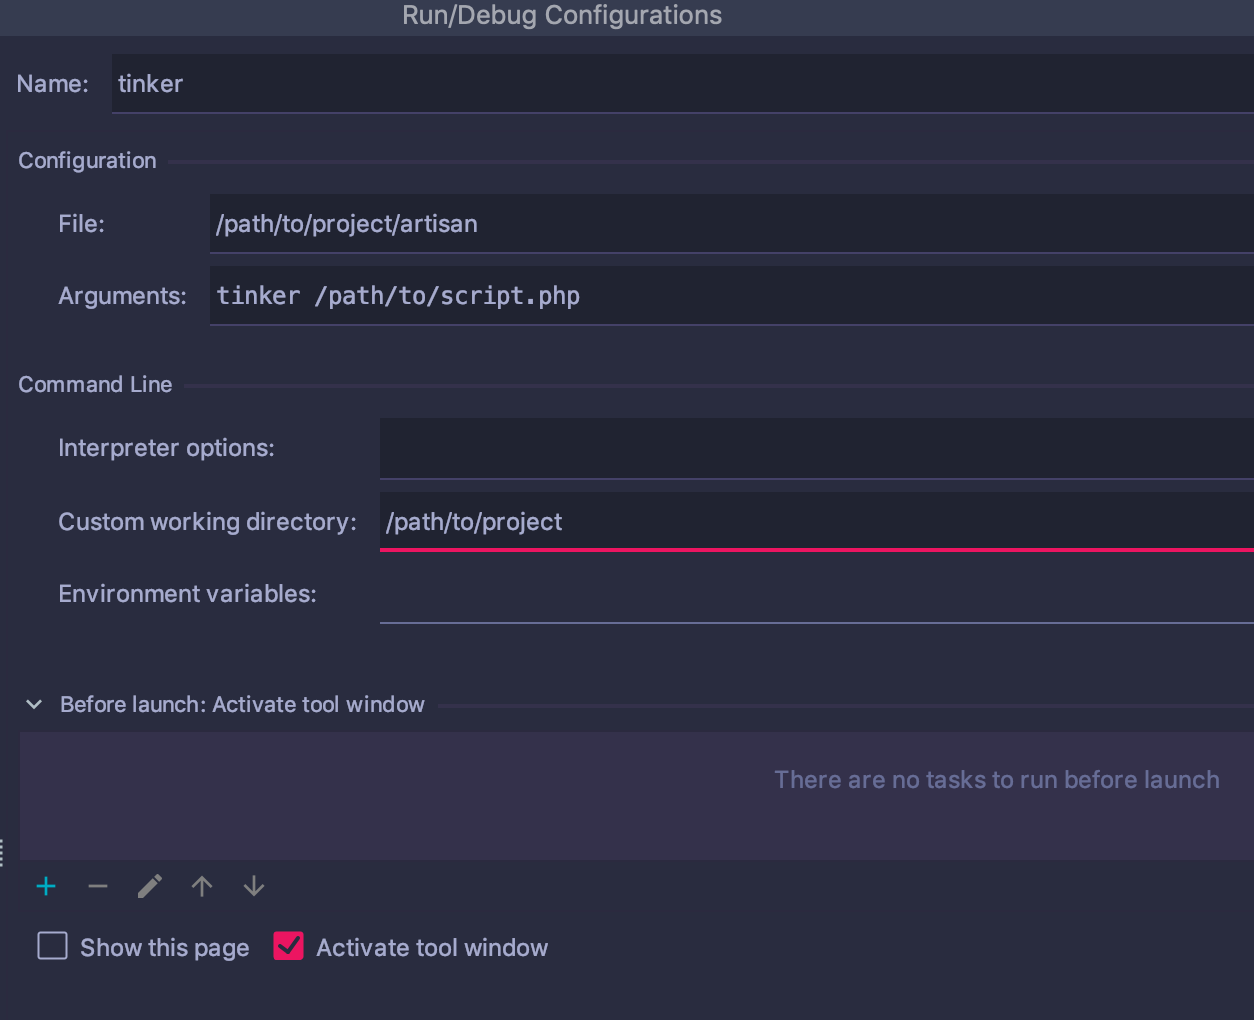
PHP Scriptを選択し、下記のように設定します-
File: プロジェクトのartisanファイルのパス -
Arguments: PHPファイルのパス - Custom workin directory:
tinker <プロジェクトのパス>
-
- あとはPHPファイルにブレークポイントを貼って、上部メニューからゴキマークを押してあげればOKです

実行時はこんな感じ
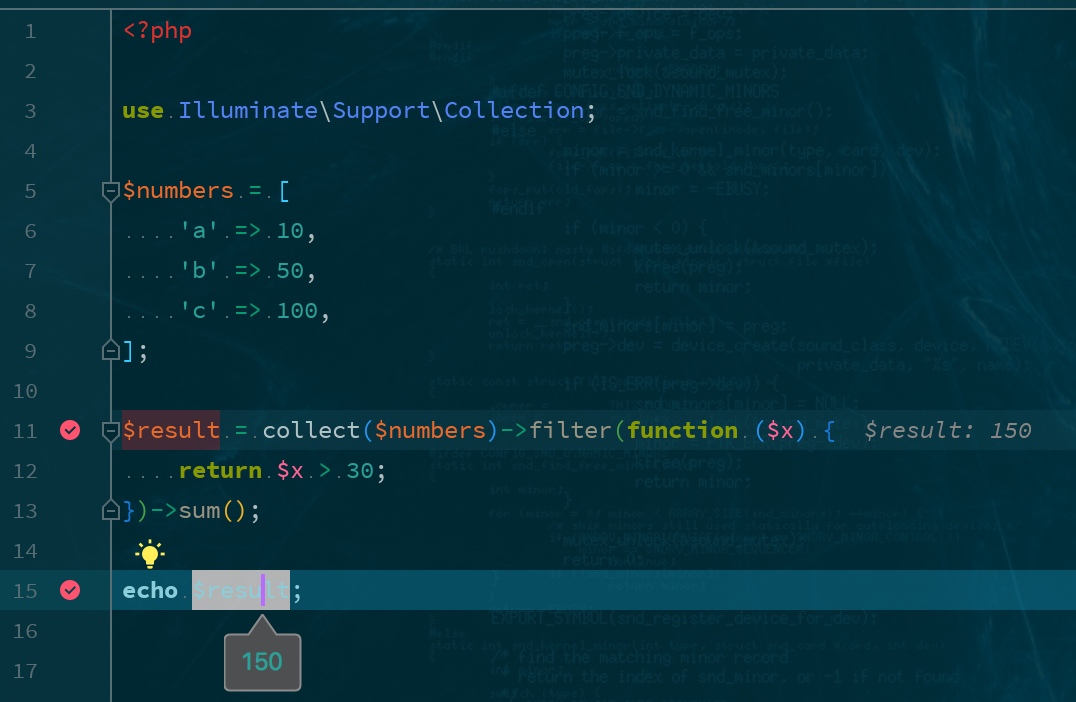
tinkerを叩いているだけなのでEloquentの操作とか色々試せて便利ですよ