背景
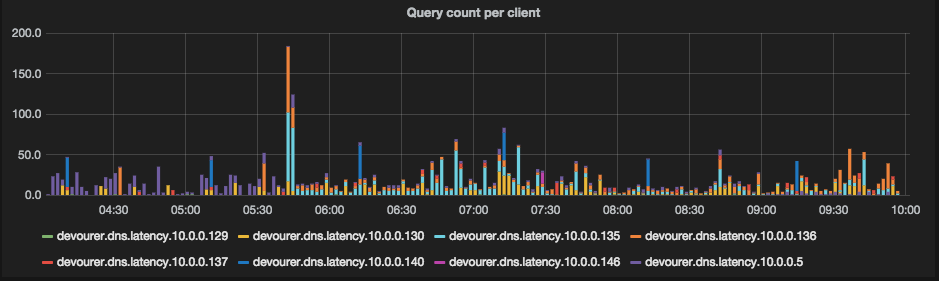
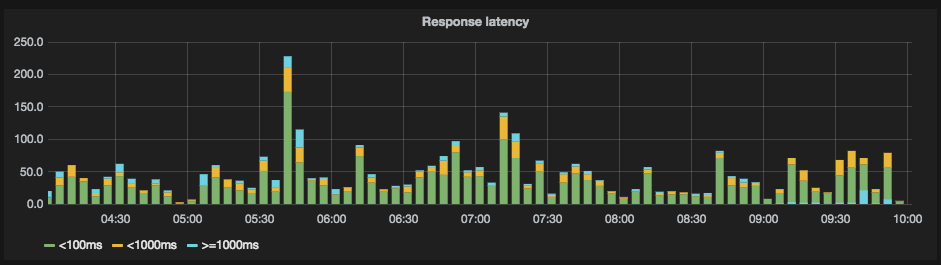
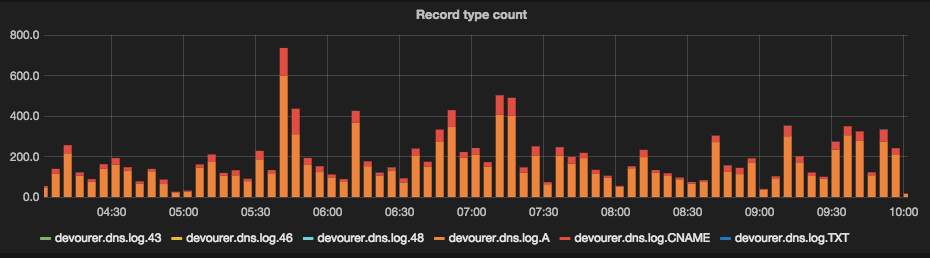
管理ネットワーク(自分の場合は自宅)でDNSがどのように使われているか、また問い合わせなどが正常に実施できているかの監視のための構成を作成しました。これによって以下の様なグラフを見ることができます。
クライアント毎の問い合わせ数推移
クエリの応答時間内訳(100ms未満、1000ms未満、1000ms以上)
レコードタイプの内訳(Aレコード、MXレコード、など)
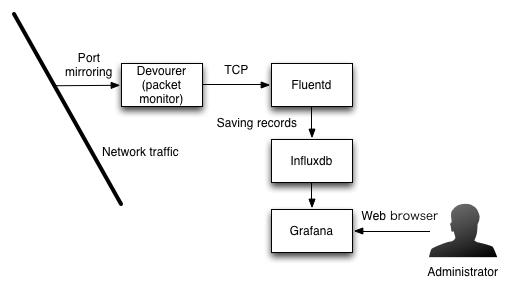
構成
Devourer(自作ツール)でネットワークパケットをすいとり、Fluentdに転送、そこからinfluxDBにデータを入れてGrafanaで可視化します。
設定方法
InfluxDBのセットアップ
基本はInfluxDBで解説されている手順通りですが、例えばUbuntu 64bitの場合は以下のとおりインストール&起動します。
wget http://s3.amazonaws.com/influxdb/influxdb_latest_amd64.deb
sudo dpkg -i influxdb_latest_amd64.deb
sudo service influxdb start
起動したら http://<server>:8083/ で接続すると管理画面がでてくるので、user: root、password: rootでログインし、devourerとgrafanaの2つのDBを作成します。前者はデータストア用、後者はgrafanaの設定情報保存用になります。
Fluentdのセットアップ
設定環境にRubyがインストールされていて、gemが使える状態になっているものとします。
gem install fluentd fluent-plugin-influxdb
fluentd --setup ./fluent
fluent/fluent.confを以下のように編集します。
<source>
  type forward
  port 24224
  bind 0.0.0.0
</source>

<match devourer.**>
  type copy
  <store>
    type stdout
  </store>

  <store>
    type influxdb
    host localhost
    port 8086
    dbname devourer
    user root
    password root
    time_precision s
    flush_interval 1s
  </store>
</match>
その後、以下のコマンドで起動させます。
% fluentd -c fluent/fluent.conf
Devourerのセットアップ
多目的ネットワーク監視ツールとして実装しています(自作品です)swarmというライブラリも必要になります。また、libpcap、libevを使ったプログラムがコンパイル出来る状態になっている必要があります。
また、構成図にはport mirroringと書きましたが、PCルータ上などでも動作します。
% git clone https://github.com/m-mizutani/swarm.git
% cd swarm
% cmake . && make
% cd ..
% git clone https://github.com/m-mizutani/devourer.git
% cd devourer
% cmake -DINC_DIR=../swarm/src -DLIB_DIR=../swarm/lib .
% make
% sudo make install
以下のコマンドで起動します。
% sudo devourer -i eth0 -f localhost:24224
監視インターフェースの指定(例ではeth0)とfluentdの宛先ホスト(例ではlocalhost)は適宜変更してください。
Grafanaの設定
安定版(2014年10月30日の時点では1.8.1)をダウンロードしてインストールします。
% wget wget http://grafanarel.s3.amazonaws.com/grafana-1.8.1.zip
% unzip grafana-1.8.1.zip
% cd grafana-1.8.1
% cp config.sample.js config.js
config.jsを以下のように編集します。
define(['settings'],
function (Settings) {
  return new Settings({
    datasources: {
      influxdb: {
        type: 'influxdb',
        url: "http://10.0.0.1:8086/db/devourer",
        username: 'root',
        password: 'root',
      },
      grafana: {
        type: 'influxdb',
        url: "http://10.0.0.1:8086/db/grafana",
        username: 'root',
        password: 'root',
        grafanaDB: true
      },
    },

    search: {
      max_results: 20
    },
    default_route: '/dashboard/file/default.json',
    unsaved_changes_warning: true,
    playlist_timespan: "1m",
    admin: {
      password: ''
    },

    window_title_prefix: 'Grafana - ',

    plugins: {
      panels: [],
      dependencies: [],
    }
  });
});
Apacheなどで表示させることもできますが、今回はお手軽にpythonのCLIから起動します。
% python -m SimpleHTTPServer 9000
http://<server>:9000 にアクセスしてGrafanaの画面がでてきたら設定成功です。
ダッシュボードの設定などはWeb UIから実施できますが、influxdbのクエリなどを理解している必要が有るため、Gistに設定をexportしたjsonファイルがあるので、これをダウンロードして画面上部のフォルダのアイコン→Importで設定を取り込めます。