自社にあるものを紹介
Lookerを導入し色んなDashboardを作っていっています。
ただ他社のdashboardとか表ってどんな風な見た目にしてるのかな?と気になりつつもデータが絡んでいたりするので気軽に社外に出せるものでもないと思います。今回は僕の働いているDiverseという会社ではこんな感じの表やこんな感じの項目を表示してたりしてるという共有ができたらと思います。
⚠️connectionしているDBがTreasureDataなのでBigQueryだとちょっと変えてください。
先週比

先週と比較することがケースが一番多いというか需要があるのかなと思います。
今日や昨日といったdimension_groupを定義し、
day_of_week_indexを比較するカスタムフィルターで表示したい曜日を制限しています。
  // 今日の日付のdimension
  dimension_group: today {
    label: "今日"
    type: time
    datatype: epoch
    timeframes: [raw, time, hour, hour_of_day, day_of_month, day_of_week_index, date, week, month, year]
    sql: to_unixtime(NOW());;
  }
// カスタムフィルター
${table.today_day_of_week_index} = ${table.hoge_at_day_of_week_index}
男女デバイス別

デバイス別で何かを表したい時に絵文字とかを入れたりしています。
🍎 => iOSアプリ
🤖 => Androidアプリ
👨 => 男性
👩 => 女性
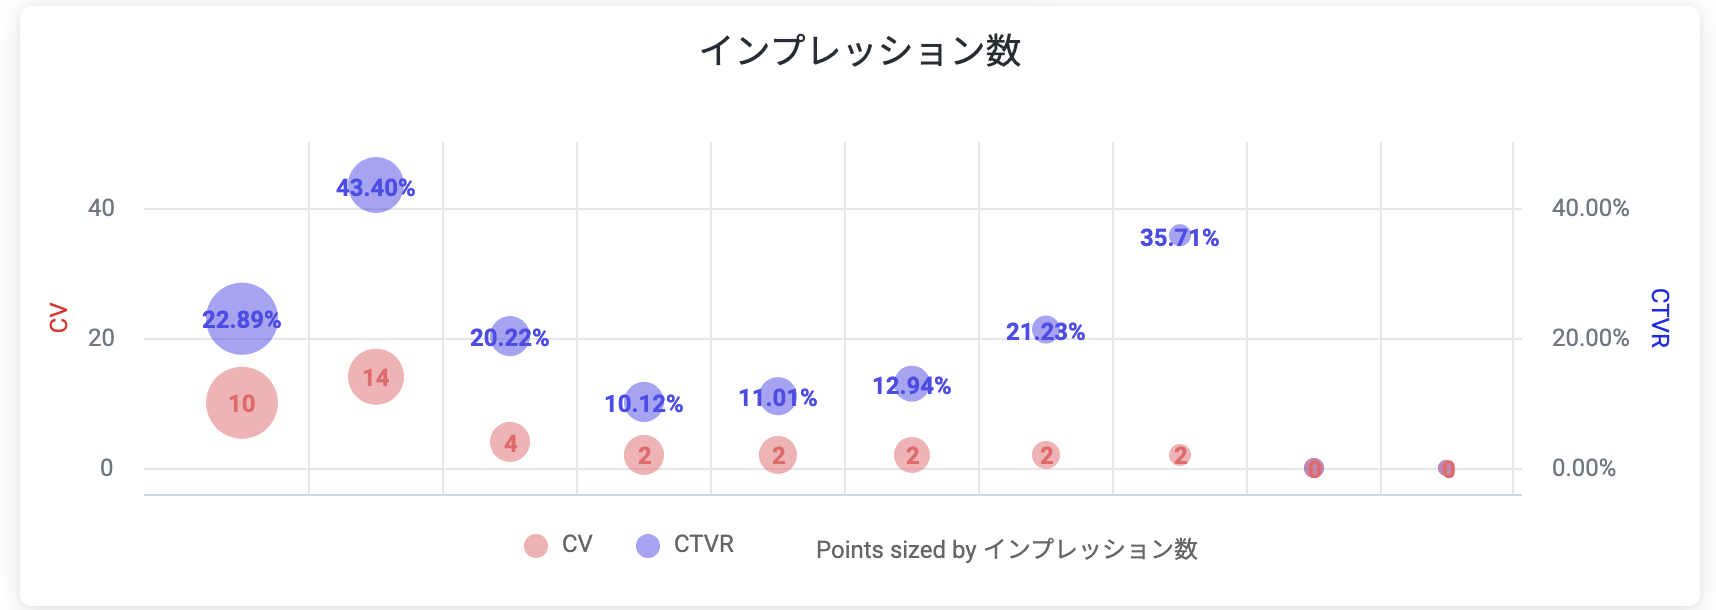
広告ごとのインプレッション数を理解しやすくする表

(scatterPivotを使いたくて作った表です)
この表使ってこれみるといいよみたいなのがあると教えていただけると嬉しいです。
boxpivotで中央値の推移
以上な行動をされる方などがいると辺なグラフになってしまうものに関しては、特定のアクション数の中央値による変化を追ったりしています。
https://docs.looker.com/exploring-data/visualizing-query-results/boxplot-options

土日で色を変える
土日で数値がかわることが多く、雑多にグラフにしているとこれは土日の変化なのか・・・?と思うことが多々あり色を変えたりもしています。

  dimension: date_color {
    label: "date"
    sql: ${time_date} ;;
    html: {% if time_day_of_week_index._value == 5 %}
          <font color="blue"> {{ value }} </font>
          {% elsif time_day_of_week_index._value == 6 %}
          <font color="red"> {{ value }} </font>
          {% else %}
          {{ value }}
          {% endif %}
          ;;
  }
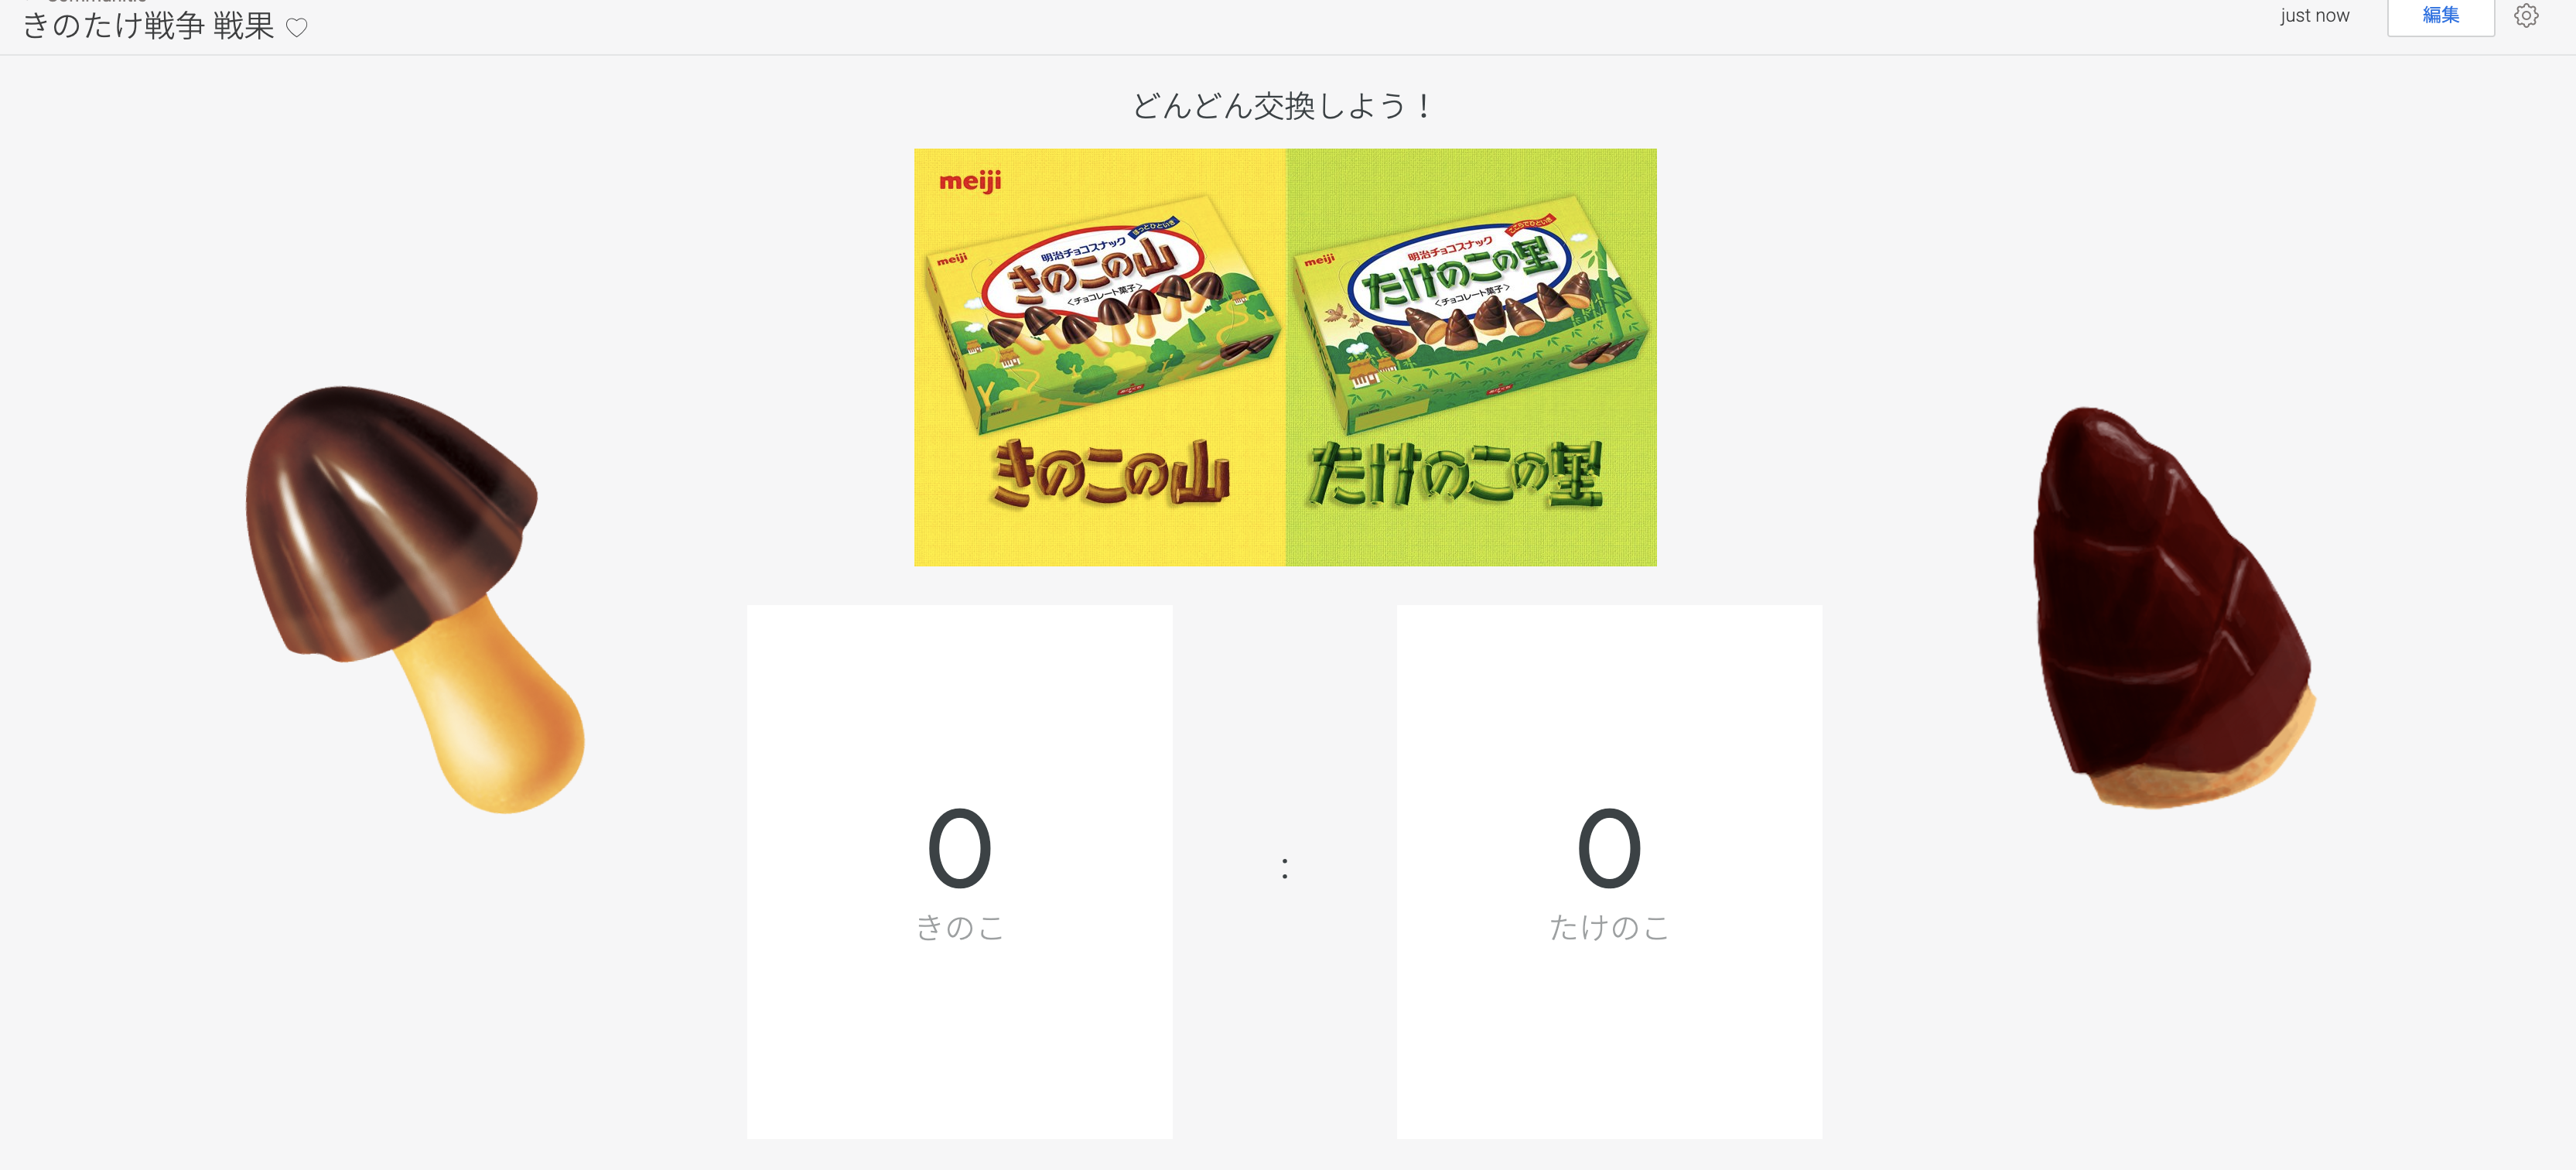
おまけ 社内できのたけ戦争をした時の戦況報告表

どちらの派閥の方もいると思うので両者引き分けの状態です。
テキストのところにimageタグを入れ込んでいるだけです。
(画像を勝手に利用してしまったので怒られるかもしれないので、問題がありそうなら削除します)
まとめ
なんだかんだ一番使っているのはテーブルの表だったりするんですが、そればかりだと面白くないと思いつつも無難な形に毎回なっています。
他の会社の人ってどう言った形でデータをまとめられているのか気になる...。