はじめに
はじめまして。
先日、新人エンジニアとして初めてプロジェクトに参画し、Next.jsを使ってWebアプリケーション開発を行いました!
開発の中でインタラクティブな地図の描画を行ったので、今回は「Next.js と D3.js で日本地図を描画するシンプルなアプリケーション」の作成についてご紹介します。
地図データを視覚化することで、エリア選択や都道府県ごとの人口識別が簡単にできるだけでなく、UIが映えるので良いな~と思いました!
1. 使用するもの
(1) Next.js
(2) D3.js (Data-Driven Documents)
技術概要については、以下の項目で簡単に紹介します。
2. 技術概要
Next.js(公式サイト:https://nextjs.org/)
Next.js は、 ReactをベースとしたJavaScriptのフレームワーク。Webアプリケーション開発に必要な様々な機能を追加している。
例えば、サーバーサイドレンダリング(SSR)や静的サイト生成(SSG)、ルーティングなどの機能が組み込まれており、効率的な開発が可能となる。
D3.js(Data-Driven Documents)(公式サイト:https://d3js.org/)
データの可視化を行うための無料かつオープンソースのJavaScriptライブラリ。
Web標準技術(SVG、Canvas、DOM)を活用して自由度の高いデータ可視化を実現できる。
また、細かくカスタマイズ可能で、複雑なグラフやチャートの作成、インタラクティブな可視化などのグラフィック制作に適している。
手順
前提として、Node.jsがインストールされている状態とします。
1. 地図データの準備
D3.jsで地図を描画するためには、描画したい地図のjsonデータまたはgeojsonデータが必要になります。
今回は日本地図を描画したいので、日本地図のgeojsonデータを取得します。
日本地図のgeojsonデータは、国土交通省のサイトからダウンロードしてきます。
国土交通省ダインロードサイト:https://nlftp.mlit.go.jp/ksj/gml/datalist/KsjTmplt-N03-2024.html
2. プロジェクトのセットアップ
(1) 必要なパッケージのインストール
まず、以下のコマンドで必要な依存関係をインストールし、Nextのプロジェクトを立ち上げます。
npx create-next-app@latest
次に、d3.jsをインストールします。
npm install d3@latest
(2) プロジェクトのディレクトリ構造
ディレクトリ構造は以下です。
今回は、用意した地図のgeojsonデータをpublic直下に置きます。
また、pages.tsx にメインとなる地図の描画のためのソースコードを書いていきます。
その他、createcreate-next-appで自動的にインストールされたファイルには手を加えません。
my-next-app/
├── node_modules/         # プロジェクトの依存パッケージ
├── public/               # 静的ファイル(画像、アイコンなど)
│   ├── favicon.ico
│   └── map.geojson       # 用意した地図のgeojsonデータ
├── styles/               # グローバルCSSファイル
│   ├── globals.css
│   └── Home.module.css
├── pages/                # ページ(自動でルーティングされる)
│   ├── api/              # APIルート
│   ├── pages.tsx         # カスタムコンポーネント
│   └── index.tsx         # メインのランディングページ
├── components/           # 再利用可能なUIコンポーネント
│   ├── Header.tsx
│   └── Footer.tsx
├── lib/                  # ヘルパー関数やユーティリティ
├── next.config.js        # Next.jsの設定ファイル
├── package.json          # プロジェクトの依存関係やスクリプト
├── tsconfig.json         # TypeScriptの設定
└── .gitignore            # Gitで無視するファイル
3. D3.js による地図描画
D3.jsを使用し、地図を描画していきます。
以下は、用意したgeojsonデータを読み込んで描画するためのソースコードです。
'use client';

import { useEffect, useRef, useState } from 'react';
import * as d3 from 'd3';

// GeoJSONデータの型定義
interface GeojsonFeature {
  type: string;
  geometry: {
    type: string;
    coordinates: any;
  };
  properties: { [key: string]: any };
}

// GeoJSON全体の型定義
interface Geojson {
  type: string;
  features: GeojsonFeature[];
}

const Home = () => {
  const mapContainerRef = useRef<HTMLDivElement | null>(null);
  const [geojson, setGeojson] = useState<Geojson | null>(null);

  // GeoJSONデータを非同期に読み込む
  useEffect(() => {
    fetch('/map.geojson') // Next.js では `/public` フォルダがルートディレクトリに対応します
      .then((response) => response.json())
      .then((data) => setGeojson(data))
      .catch((error) => console.error('GeoJSONの読み込みエラー:', error));
  }, []);

  // コンポーネントがマウントされた後に地図を描画
  useEffect(() => {
    if (!geojson || !geojson.features) return;

    const mapContainer = mapContainerRef.current;
    if (!mapContainer) return;

    // コンテナの幅と高さを取得
    const containerWidth = mapContainer.offsetWidth;
    const containerHeight = mapContainer.offsetHeight;

    // SVG要素を作成
    const svg = d3.select(mapContainer)
      .append('svg')
      .attr('width', containerWidth)
      .attr('height', containerHeight);

    // 地図投影法の設定(Mercator投影)
    const projection = d3.geoMercator()
      .center([137, 36]) // 日本を中心に設定
      .scale(1000) // ズームのスケール調整
      .translate([containerWidth / 2, containerHeight / 2]); // 中心位置をSVGの中央に設定

    const geoPath = d3.geoPath().projection(projection);

    // 地図の描画
    svg.selectAll<SVGPathElement, GeojsonFeature>('path')
      .data(geojson.features)
      .enter().append('path')
      .attr('d', (d) => geoPath(d as any))
      .attr('stroke', 'gray')
      .attr('stroke-width', 0.5)
      .attr('fill', '#cccccc');

    // コンポーネントのクリーンアップ
    return () => {
      d3.select(mapContainer).selectAll('*').remove();
    };
  }, [geojson]);

  return (
    <div style={{ width: '100%', height: '100vh' }}>
      <div ref={mapContainerRef} style={{ width: '100%', height: '100%' }}></div>
    </div>
  );
};

export default Home;
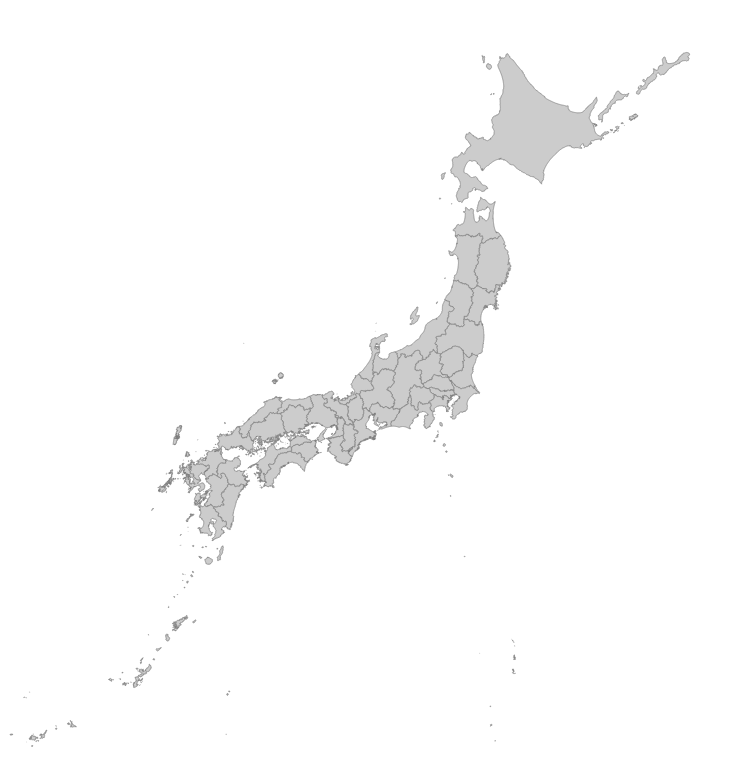
シンプルな日本地図が描画されます。
4. インタラクションの追加
ここでは以下2つのインタラクションの実装例をご紹介します。
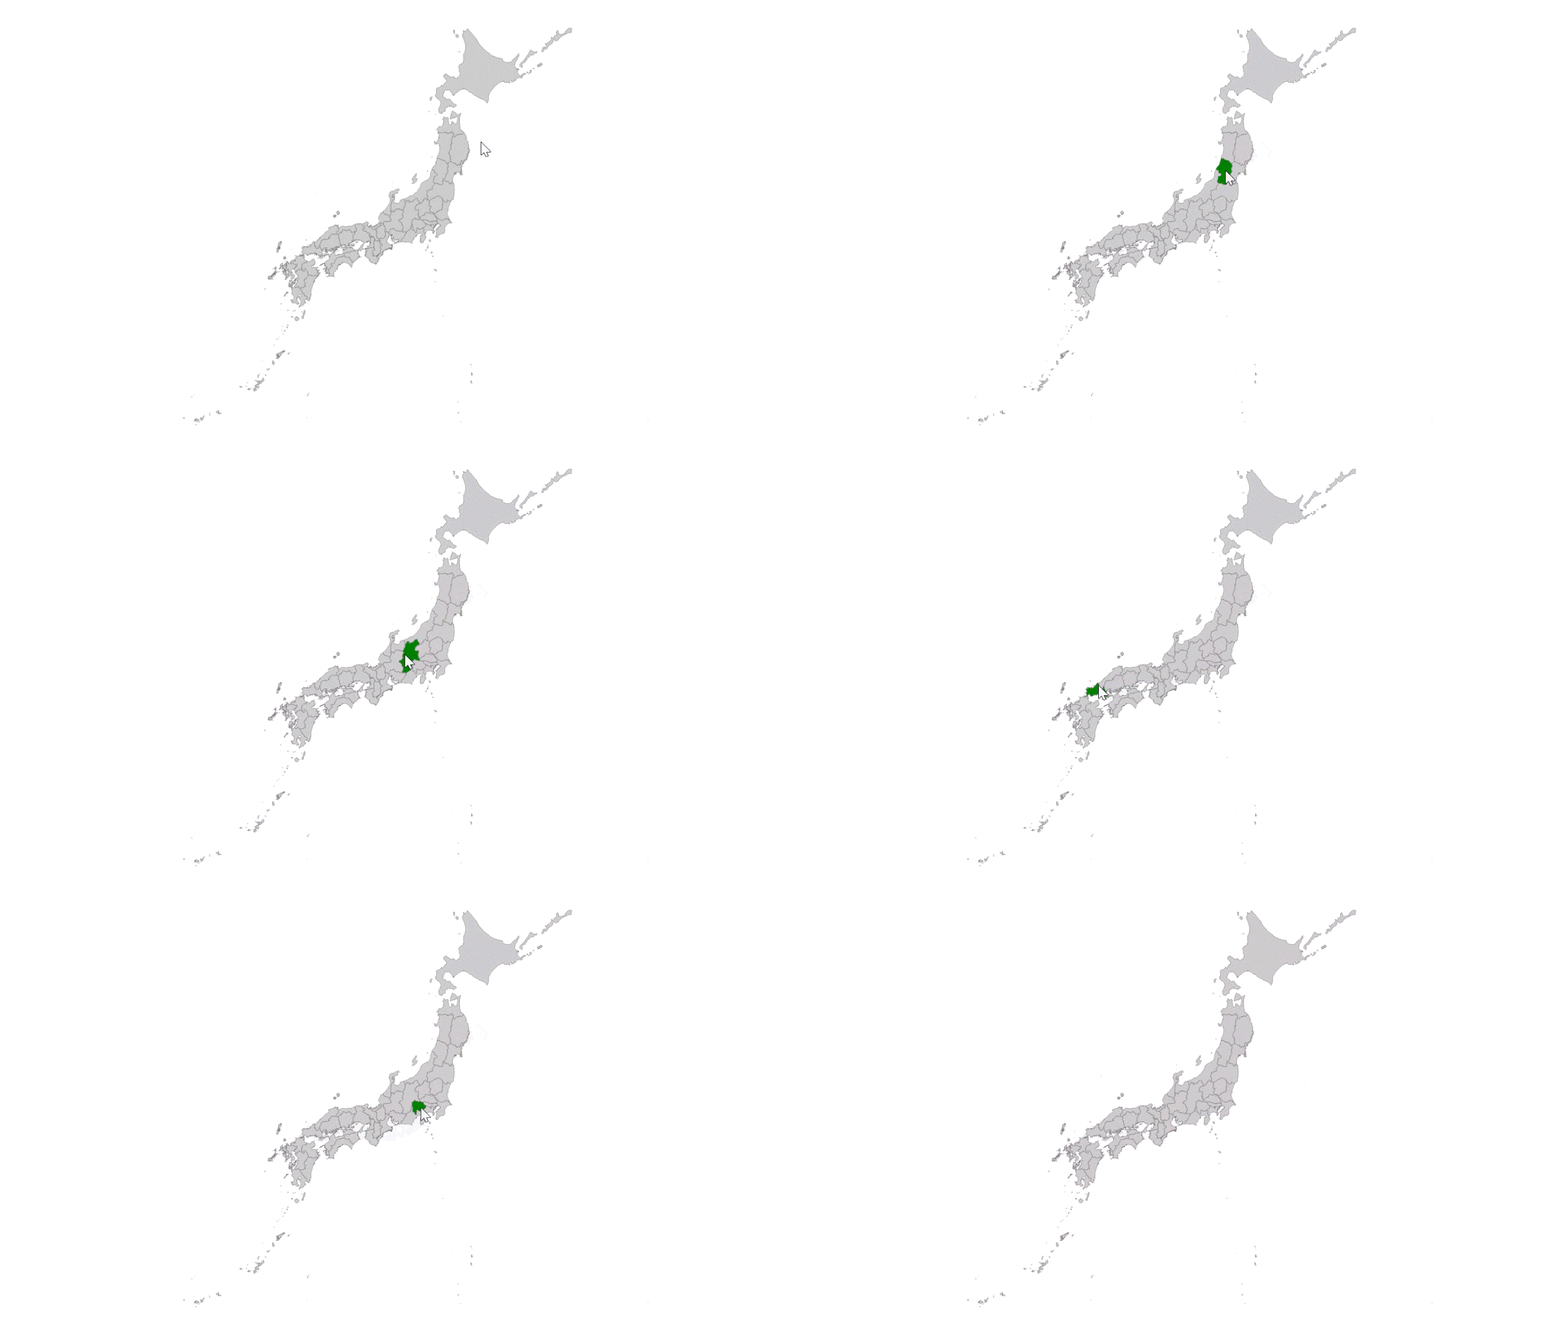
(1) カーソルを当てた都道府県の色を変える(ホバーイベント)
(2) クリックした都道府県のズーム(クリックイベント)
(1) ホバーイベントの追加
以下の変更を追加することで、地図上で都道府県にマウスを乗せるとその色が緑色に変わり、マウスが離れると元の色に戻ります。
.on('mouseenter', function () {
  d3.select(this).attr('fill', 'green'); // ホバー時に色を緑色に変更
})
.on('mouseleave', function () {
  d3.select(this).attr('fill', '#cccccc'); // ホバーを外したら元の色に戻す
});
(2) クリックイベントの追加
以下の変更を追加することで、地図上でクリックした都道府県をズームすることができます。
.on('click', function (event, d) {
        const [centerX, centerY] = d3.geoPath().centroid(d as any); // クリックした都道府県の中心座標を取得

        // ズーム用の新しいプロジェクション設定
        const zoomedProjection = d3.geoMercator()
          .center([centerX, centerY]) // クリックした都道府県を中心に設定
          .scale(4000) // ズームのスケール設定
          .translate([containerWidth / 2, containerHeight / 2]);

        // 新しい投影法を適用し、地図を再描画
        geoPath.projection(zoomedProjection);

        svg.selectAll<SVGPathElement, GeojsonFeature>('path')
          .attr('d', (d) => geoPath(d as any)); // 新しい投影法に基づいて再描画
      });
最後に
初めてのWebアプリケーション開発で実装した内容の一部をご紹介しました。
「もっとこんな方法あるよ~」、「ここ間違ってるよ~」などありましたら、ご指摘お願いします!
また、記事の内容が『役に立った』『面白かった』と思ったら、ぜひをLGTMを頂けると嬉しいです!
参考
https://qiita.com/alclimb/items/31d4360c74a8f8935256
https://zenn.dev/ckoshien/articles/38d90213401961
https://musclecoding.com/what-is-nextjs/


