この記事では、以下のように D3.js を使用して描画した地図に対して、インタラクティブに制御する方法を共有します。
地図を自在に描画・制御できると、色々と幅が広がりそうでワクワクします。
1. D3.js とは
D3.js はデータに基づいてドキュメント(SVG や DOM など)を操作するための JavaScript ライブラリです。
今回は D3.js を使い地図情報(GeoJson データ)から SVG を生成してブラウザに描画します。
2. 地図データの準備
D3.js を使ってブラウザで地図を描画するためには GeoJson 形式のファイルを用意する必要があります。
ネット上を探してみると直ぐに利用できる状態の GeoJson 形式ファイルもありますが、ここでは信頼性のありそうでライセンス的に扱いが簡単な Natural Earth からデータを取得して加工する方法を解説します。
(手っ取り早く加工済みの GeoJson データが欲しい方は こちら からどうぞ)
(1) Natural Earth / 世界地図のデータを取得
Natural Earth から世界地図をダウンロードします(次の工程で日本地図のみになるように加工します)。
サイト上の Downloads => Large scale data, 1:10m => Cultural => Admin 1 – States, Provinces => Download states and provinces から取得しておけば日本の都道府県別情報を含むデータを取得できます。
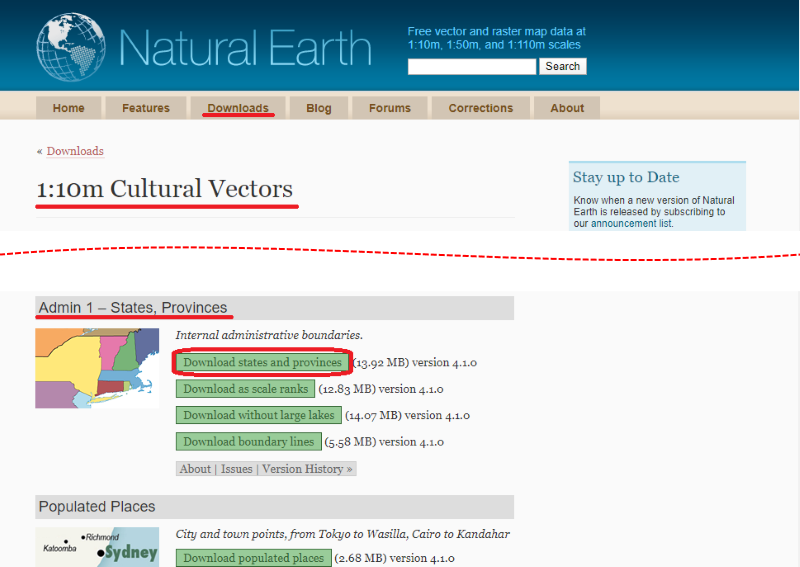
なお、地図データのライセンスはかなり緩いようです。以下の場所から原文を確認できます。
Natural Earth の利用規約
https://www.naturalearthdata.com/about/terms-of-use/
(2) QGIS v3.12 / 地図を加工・ファイル形式変換ソフト
- Windows, macOS, Linux などで動作するフリーソフトです
- 地形のデータとなる点を移動したり不要な地形を削除したり加工ができます
- Natural Earth から取得した
.shp形式のファイル から GeoJson 形式に変換できます
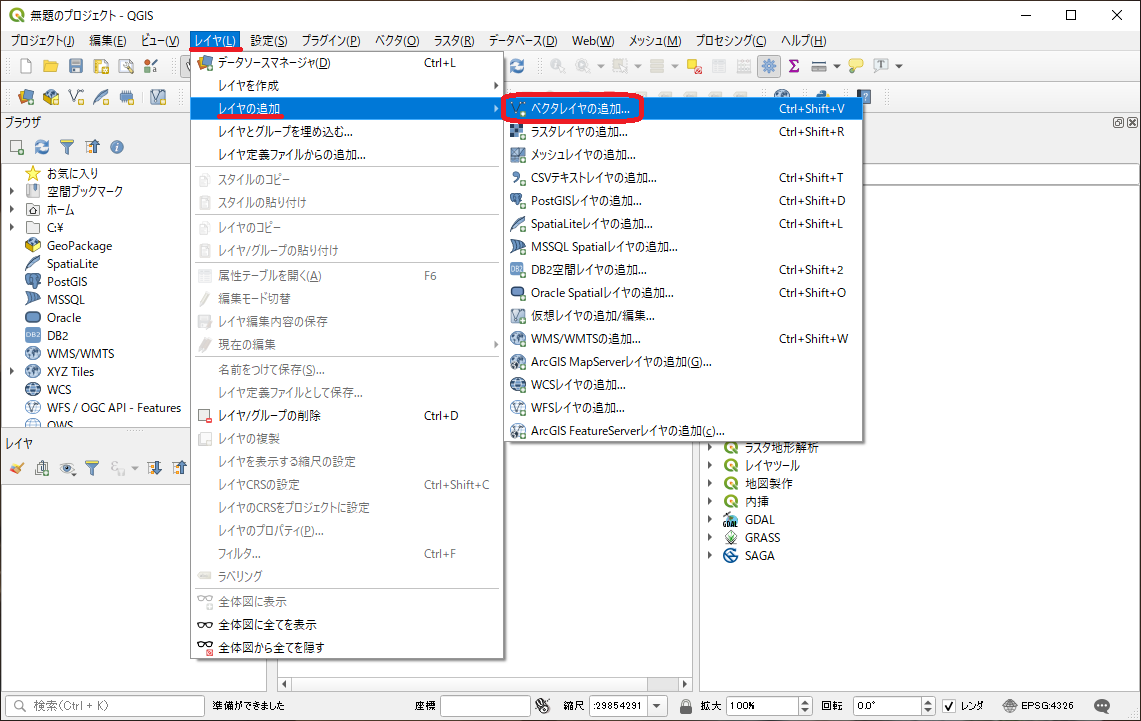
a) レイヤ => レイヤの追加 => ベクタレイヤの追加 を選択
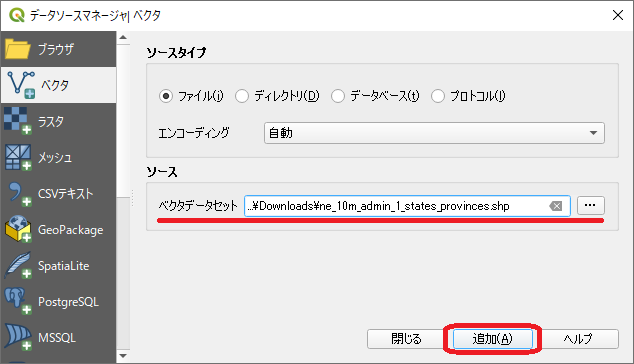
b) Natural Earth で取得した shp ファイルをベクタデータセット に指定して 追加 ボタンをクリック
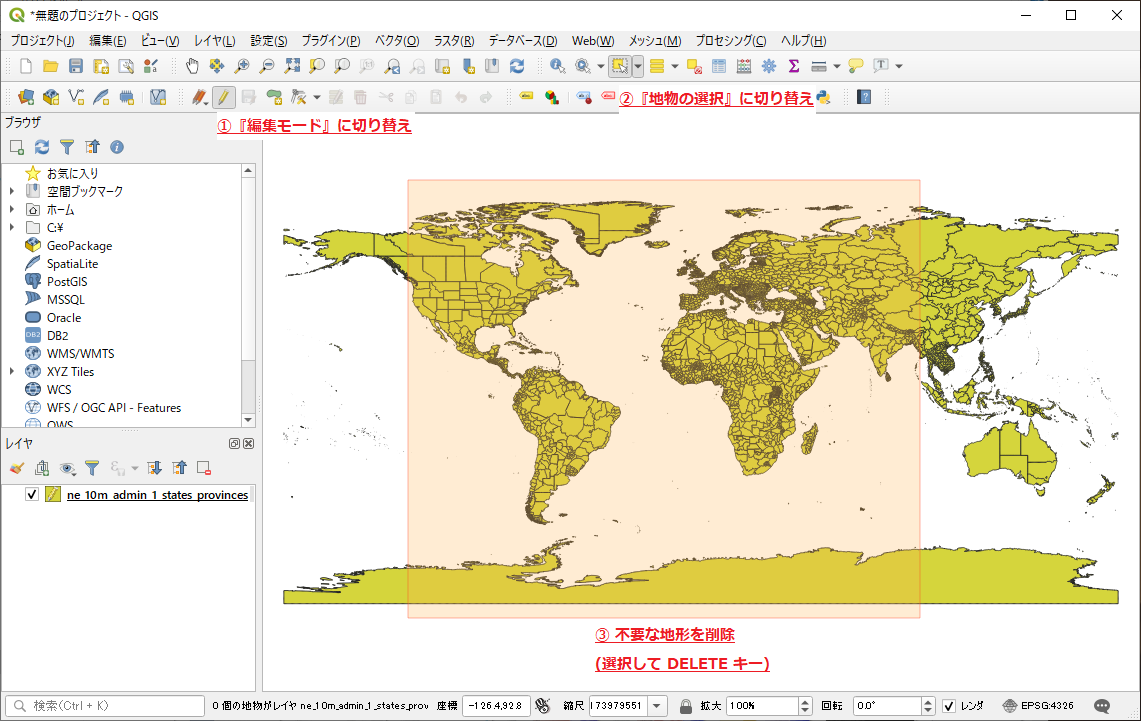
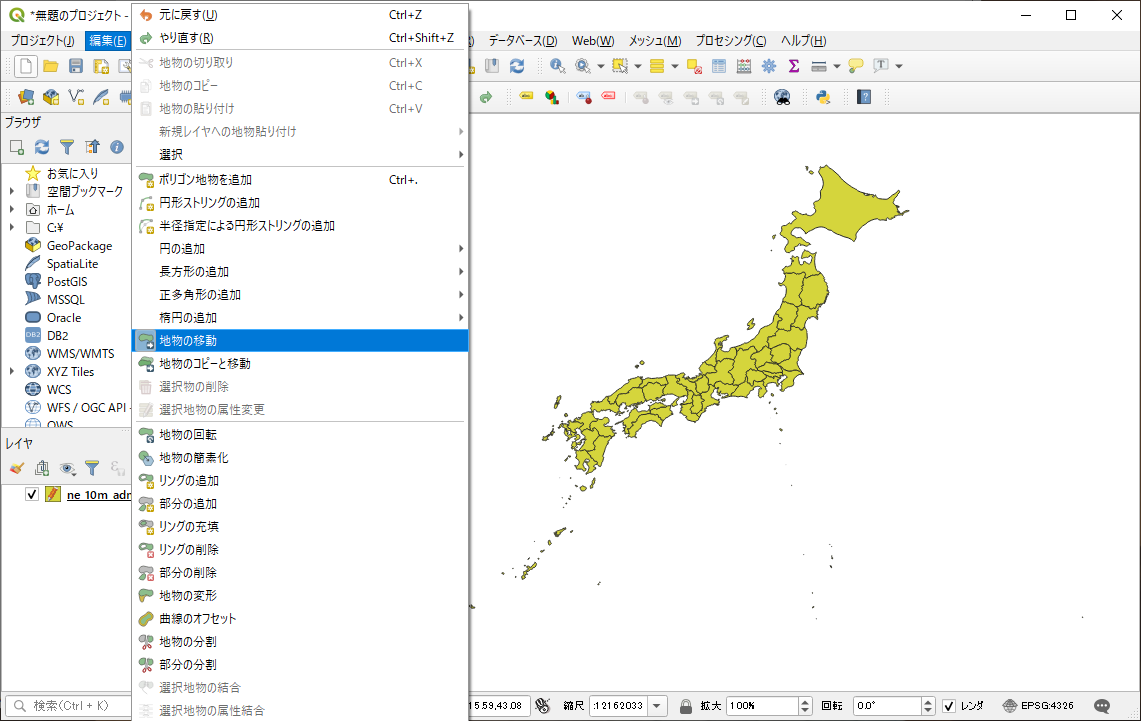
c) ① 編集モードに切り替え => ② 地物の選択に切り替え => ③ 不要な地形を削除
d) 編集メニューから地物ポリゴンを移動させたり、新たにポリゴンを追加も可能
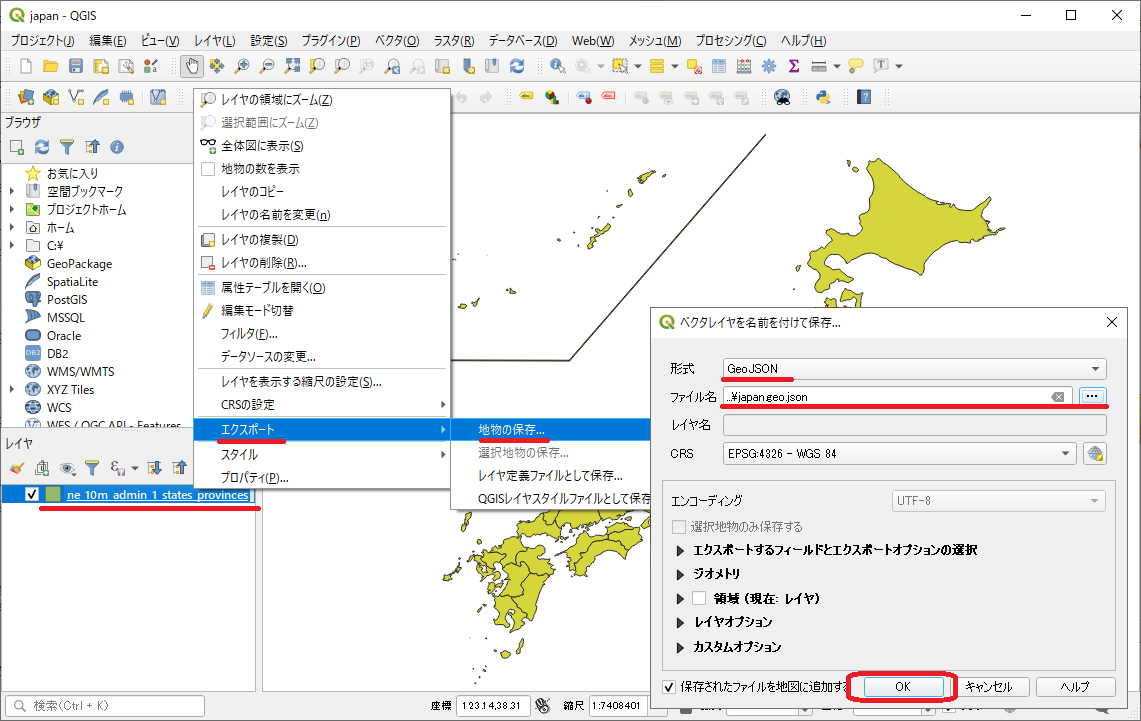
e) GeoJson データ形式としてエクスポート
(3) mapshaper / 地図データの軽量化サービス
- 地形のデータとなる点情報をイイ感じに削減してデータを軽量化できます
- (QGIS からでも軽量化できますが使いやすいのでこのサービスを利用しました)
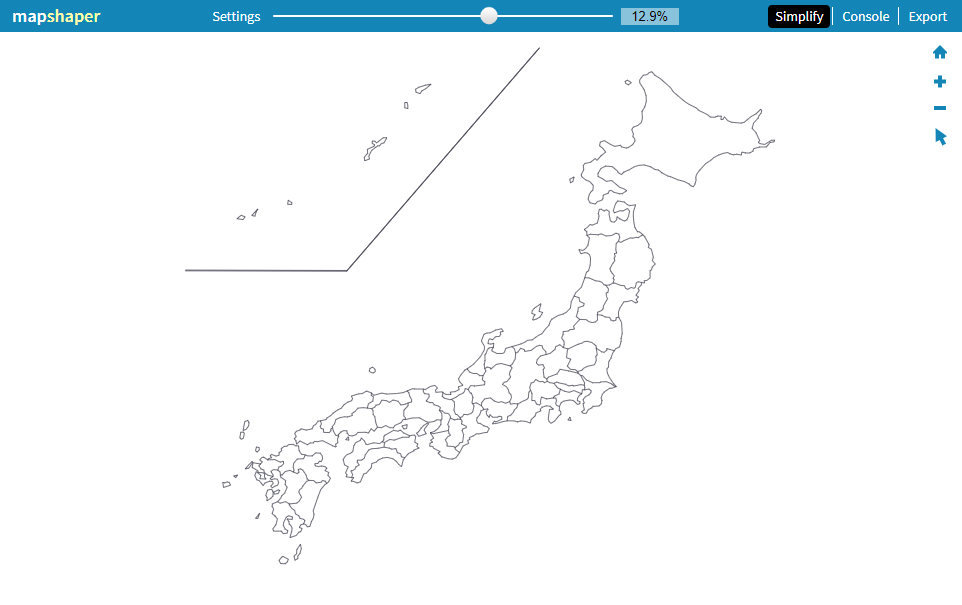
Simplify ボタンから表示されるスライダーで軽量化、Export ボタンで出力できます。
3. 地図データを D3.js で描画
TypeScript のコードになりますが、JavaScript が読めれば問題ないと思います。
解説はコード内のコメントをご確認ください。
なお、最後の方に動作確認デモへのリンクも載せてあります。
> npm install d3@5.15.0
import * as d3 from "d3";

// GeoJsonファイルを読み込み
import geoJson from "~/assets/japan.geo.json";

async function main() {
  const width = 400; // 描画サイズ: 幅
  const height = 400; // 描画サイズ: 高さ
  const centerPos = [137.0, 38.2]; // 地図のセンター位置
  const scale = 1000; // 地図のスケール

  // 地図の投影設定
  const projection = d3
    .geoMercator()
    .center(centerPos)
    .translate([width / 2, height / 2])
    .scale(scale);

  // 地図をpathに投影(変換)
  const path = d3.geoPath().projection(projection);

  // SVG要素を追加
  const svg = d3
    .select(`#map-container`)
    .append(`svg`)
    .attr(`viewBox`, `0 0 ${width} ${height}`)
    .attr(`width`, `100%`)
    .attr(`height`, `100%`);

  //
  // [ メモ ]
  // 動的にGeoJsonファイルを読み込む場合は以下のコードを使用
  // const geoJson = await d3.json(`/japan.geo.json`);
  //

  // 都道府県の領域データをpathで描画
  svg
    .selectAll(`path`)
    .data(geoJson.features)
    .enter()
    .append(`path`)
    .attr(`d`, path)
    .attr(`stroke`, `#666`)
    .attr(`stroke-width`, 0.25)
    .attr(`fill`, `#2566CC`)
    .attr(`fill-opacity`, (item: any) => {
      // メモ
      // item.properties.name_ja に都道府県名が入っている

      // 透明度をランダムに指定する (0.0 - 1.0)
      return Math.random();
    })

    /**
     * 都道府県領域の MouseOver イベントハンドラ
     */
    .on(`mouseover`, function(item: any) {
      // ラベル用のグループ
      const group = svg.append(`g`).attr(`id`, `label-group`);

      // 地図データから都道府県名を取得する
      const label = item.properties.name_ja;

      // 矩形を追加: テキストの枠
      const rectElement = group
        .append(`rect`)
        .attr(`id`, `label-rect`)
        .attr(`stroke`, `#666`)
        .attr(`stroke-width`, 0.5)
        .attr(`fill`, `#fff`);

      // テキストを追加
      const textElement = group
        .append(`text`)
        .attr(`id`, `label-text`)
        .text(label);

      // テキストのサイズから矩形のサイズを調整
      const padding = { x: 5, y: 0 };
      const textSize = textElement.node().getBBox();
      rectElement
        .attr(`x`, textSize.x - padding.x)
        .attr(`y`, textSize.y - padding.y)
        .attr(`width`, textSize.width + padding.x * 2)
        .attr(`height`, textSize.height + padding.y * 2);

      // マウス位置の都道府県領域を赤色に変更
      d3.select(this).attr(`fill`, `#CC4C39`);
      d3.select(this).attr(`stroke-width`, `1`);
    })

    /**
     * 都道府県領域の MouseMove イベントハンドラ
     */
    .on("mousemove", function(item: any) {
      // テキストのサイズ情報を取得
      const textSize = svg
        .select("#label-text")
        .node()
        .getBBox();

      // マウス位置からラベルの位置を指定
      const labelPos = {
        x: d3.event.offsetX - textSize.width,
        y: d3.event.offsetY - textSize.height
      };

      // ラベルの位置を移動
      svg
        .select("#label-group")
        .attr(`transform`, `translate(${labelPos.x}, ${labelPos.y})`);
    })

    /**
     * 都道府県領域の MouseOut イベントハンドラ
     */
    .on(`mouseout`, function(item: any) {
      // ラベルグループを削除
      svg.select("#label-group").remove();

      // マウス位置の都道府県領域を青色に戻す
      d3.select(this).attr(`fill`, `#2566CC`);
      d3.select(this).attr(`stroke-width`, `0.25`);
    });
}

main();
以下のリンクに D3.js を使用して地図を描画するデモを用意しました。
動作デモ (StackBlitz)
https://stackblitz.com/edit/d3map
4. 最後に
勢いで書いてしまったので適当な部分もありそうですが、D3.js + 地図描画 いかがでしょうか。
記事の内容が『役に立った』『面白かった』と思ったら、ぜひ LGTM(いいね) を頂けると嬉しい限りでございます!

