・対象OS:Windows11
・wslのインストール
管理者モードで PowerShell を開き、wsl --install コマンドを入力して、コンピューターを再起動します。
※Windows11の場合はタスクバーのスタートボタンを右クリックし、「ターミナル(管理者)」からPowerShellを起動することができます。
参考:https://learn.microsoft.com/ja-jp/windows/wsl/install
・Rancher Desktopのインストール
以下のurlからRancher Desktopをダウンロードします。
url: https://rancherdesktop.io/
ダウンロードした Rancher.Desktop.Setup.x.x.x.msi(例:Rancher.Desktop.Setup.1.20.0.msi) を実行します。
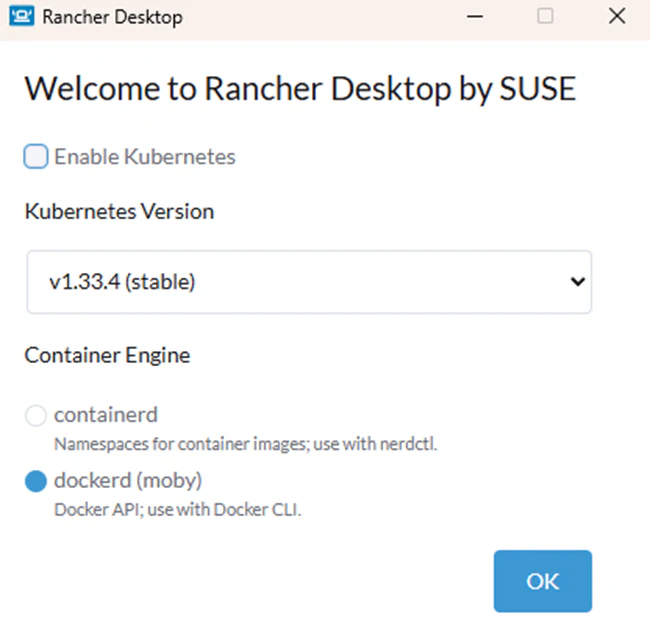
初回起動時に以下の画面が表示されます。Kubernetesを無効にし、Docker (moby) を選択し、OKをクリックします。(Preferences からも後で設定できます)
※Enable Kubernetes のチェックを外さない場合、環境によっては Rancher Desktop が起動できないことがあります。
※参考:https://blog.nekonium.com/rancher-desktop-run-on-windows/
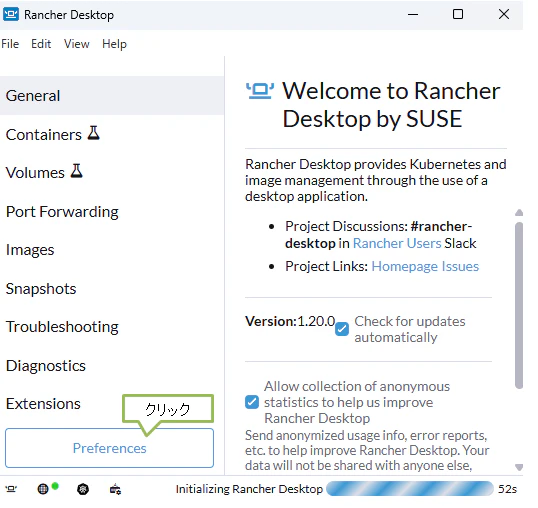
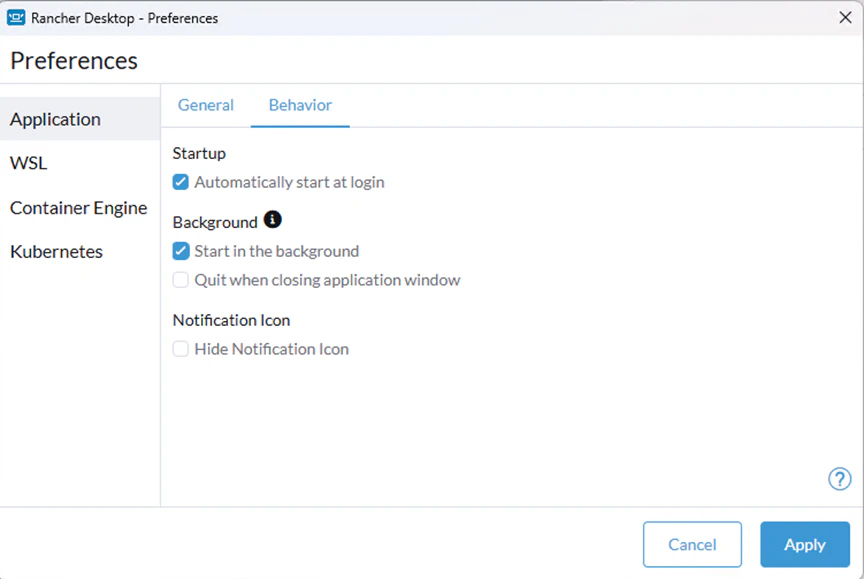
Preferencesをクリックします。Behaviorタブで以下のようにチェックを入れ、Applyボタンをクリックします。(PC起動時に自動で立ち上がり、バックグラウンドで実行されるようにする設定です)
※PC起動してからRancher Desktopが機能するまで、数分かかる場合があります。
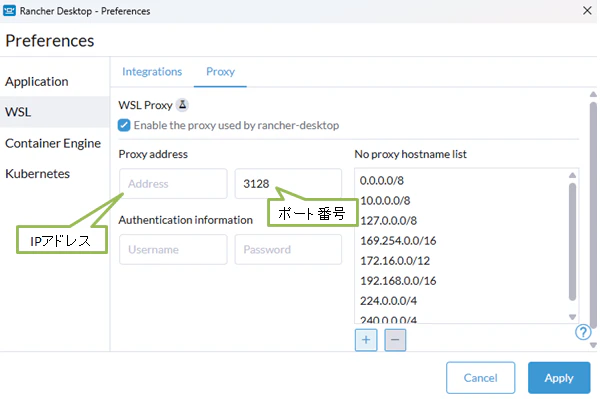
Proxy環境の場合、以下の画面でProxyアドレス(IP)とポート番号を入力し、Applyをクリックします。
1) ファイル構成(作成します)
grafana_test/
├─ docker-compose.yml
├─ initdb/
│   └─ 01_init_timescaledb.sql
├─ grafana/
│   └─ (空でOK:起動後に中身が作られます)
└─ provisioning/
     └─ datasources/
           └─ postgres.yml
2) docker-compose.yml
version: "3.9"

services:
  timescaledb:
    image: timescale/timescaledb:2.21.1-pg16
    container_name: timescaledb
    restart: unless-stopped
    environment:
      POSTGRES_DB: tsdb
      POSTGRES_USER: tsadmin
      POSTGRES_PASSWORD: tsadminpass
      PGDATA: /var/lib/postgresql/data/pgdata
    ports:
      - "5432:5432"
    volumes:
      # データ永続化
      - ./data/timescaledb:/var/lib/postgresql/data
      # 初期化SQL(初回起動時のみ実行)
      - ./initdb:/docker-entrypoint-initdb.d:ro
    healthcheck:
      test: ["CMD-SHELL", "pg_isready -U tsadmin -d tsdb"]
      interval: 10s
      timeout: 5s
      retries: 5
    networks:
      - app_net

  grafana:
    # ★ :latestから特定のバージョンに変更することを推奨
    image: grafana/grafana-oss:12.0.2
    container_name: grafana
    restart: unless-stopped
    environment:
      GF_SECURITY_ADMIN_USER: admin
      GF_SECURITY_ADMIN_PASSWORD: adminpass
    ports:
      - "3000:3000"
    depends_on:
      timescaledb:
        condition: service_healthy
    volumes:
      - ./grafana:/var/lib/grafana
      # PostgreSQL(=TimescaleDB)データソースを登録
      - ./provisioning/datasources:/etc/grafana/provisioning/datasources
    networks:
      - app_net

  pgadmin:
    image: dpage/pgadmin4:8.8
    container_name: pgadmin
    restart: unless-stopped
    environment:
      PGADMIN_DEFAULT_EMAIL: admin@example.com
      PGADMIN_DEFAULT_PASSWORD: adminpass
    ports:
      - "6060:80"
    depends_on:
      timescaledb:
        condition: service_healthy
    networks:
      - app_net

networks:
  app_net:
    driver: bridge
    ipam:
      config:
        - subnet: 192.168.212.0/24
          gateway: 192.168.212.1
3) 01_init_timescaledb.sql (initdb/01_init_timescaledb.sql)
CREATE EXTENSION IF NOT EXISTS timescaledb;

CREATE SCHEMA IF NOT EXISTS iot;

CREATE TABLE IF NOT EXISTS iot.metrics (
  ts        TIMESTAMPTZ NOT NULL,
  device_id TEXT        NOT NULL,
  temp      DOUBLE PRECISION,
  pressure  DOUBLE PRECISION,
  PRIMARY KEY (ts, device_id)
);


SELECT create_hypertable('iot.metrics', 'ts', if_not_exists => TRUE);

INSERT INTO iot.metrics (ts, device_id, temp, pressure)
SELECT
  gs AS ts,
  dev AS device_id,
  20 + 5 * sin(EXTRACT(EPOCH FROM gs)/500.0) + (random()-0.6),
  30 + 10 * cos(EXTRACT(EPOCH FROM gs)/700.0) + (random()-0.55)
FROM
  generate_series(NOW() - interval '24 hours', NOW(), interval '1 minute') AS gs,
  unnest(ARRAY['device-A','device-B']) AS dev;
4) postgres.yml (provisioning/datasources/postgres.yml)
apiVersion: 1

datasources:
  - name: TimescaleDB
    type: postgres
    access: proxy
    url: timescaledb:5432
    user: tsadmin
    secureJsonData:
      password: tsadminpass
    jsonData:
      database: tsdb
      sslmode: disable
      postgresVersion: 1600          # 目安(15なら1500)
      timescaledb: true
5) 起動
PowerShell を開き、cd コマンドで目的のパス(grafana_test フォルダーまでのパス)へ移動します。
「docker compose up -d」を入力し実行
6) Grafanaを起動
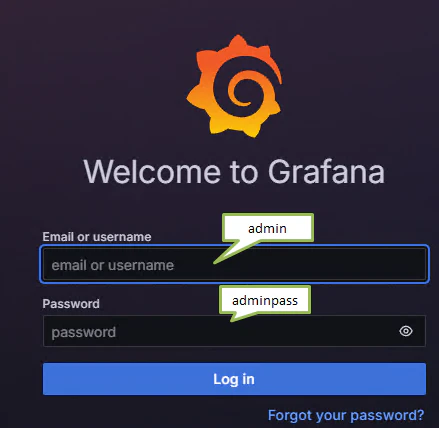
ブラウザで 「http://localhost:3000」 を開き、Username と Password を入力してログインします。
Username: admin / Password: adminpass
(docker-compose.yml の設定に基づく)
7) grafanaでdbからのデータをグラフで表示
ダッシュボードでパネルを追加し、データソースからクエリを実行して時系列データを取得します。※Visualizationsのオプションで「Time series」を選択します
クエリを定義します:データソース(TimescaleDB)を選択し、時系列データを取得するためのクエリを入力します。クエリは、Run queryボタンをクリックして実行します。
クエリ例:
SELECT
  ts, temp, pressure
FROM iot.metrics
WHERE $__timeFilter(ts)
AND device_id = 'device-A'
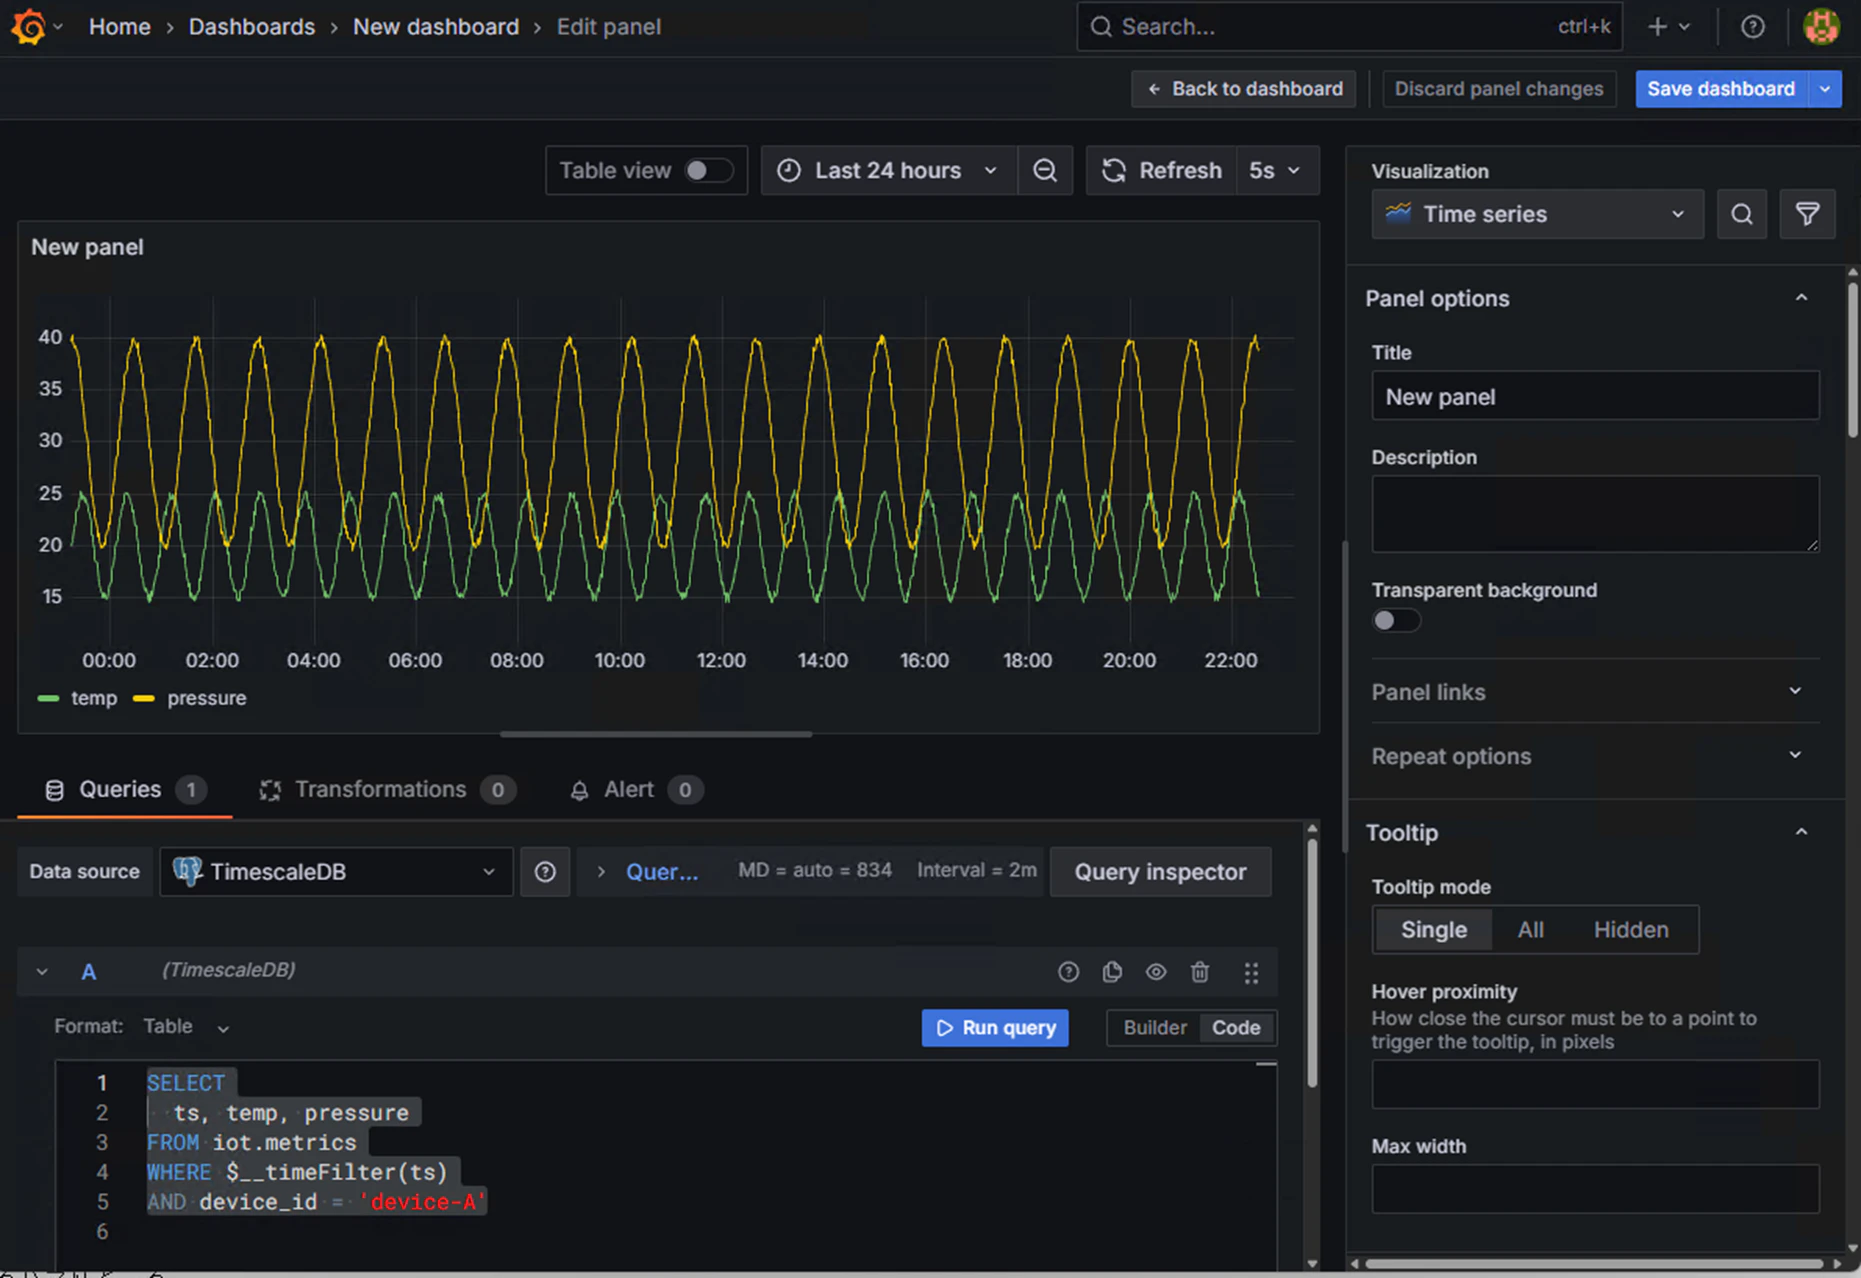
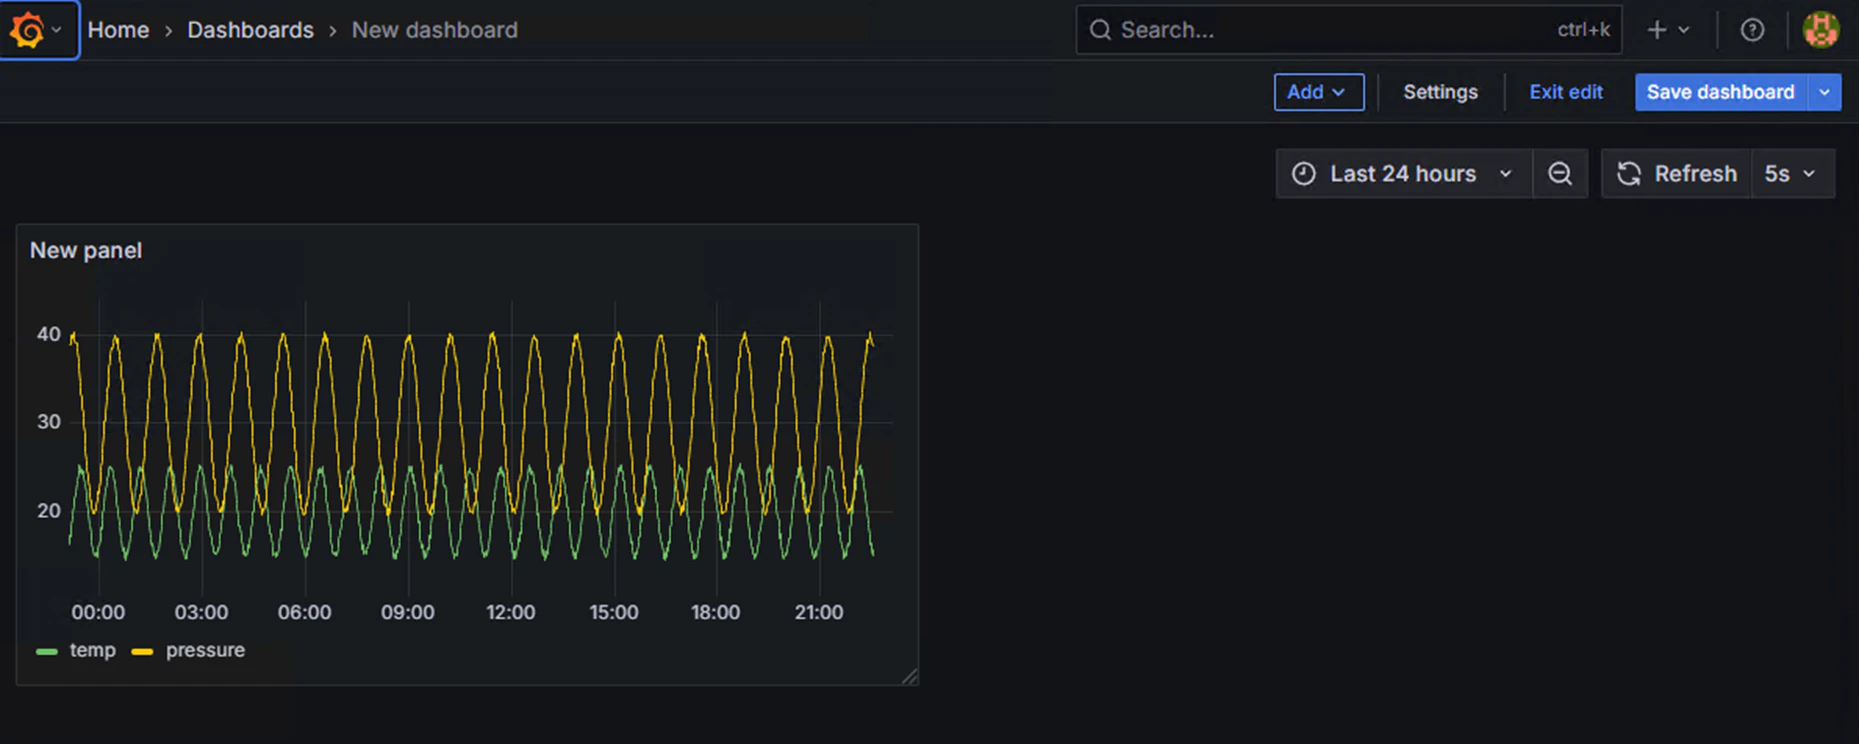
Save dashboardでダッシュボードを保存し、「Back to dashboard」でダッシュボードの表示画面へ戻ります
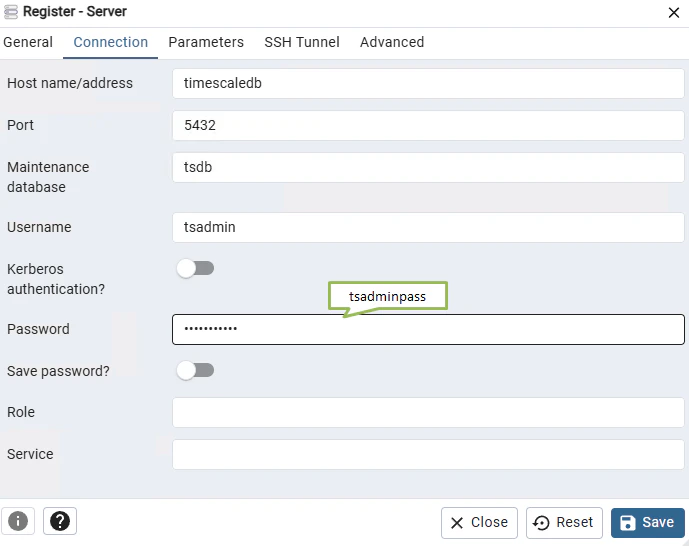
PgAdminを起動
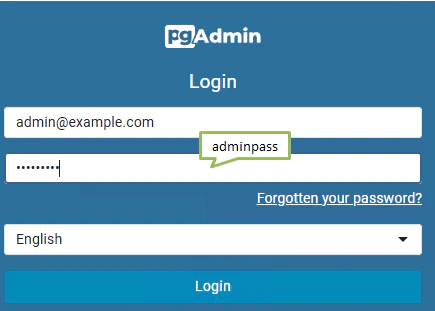
ブラウザで 「http://localhost:6060」 を開き、Email Address と Password を入力してログインします。
Email Address: admin@example.com / Password: adminpass
(docker-compose.yml の設定に基づく)
接続に必要な入力は下図の通りです。(docker-compose.yml の設定に基づく)
補足:
作成し直す場合:grafana_test中のdataフォルダーを削除し、関連コンテナ、イメージなどを削除してから行います。