あれ、あのグラフってどんな感じだったっけ?というときにさらっと書いて確認したい(のでWarningとかが出ても気にしない)。
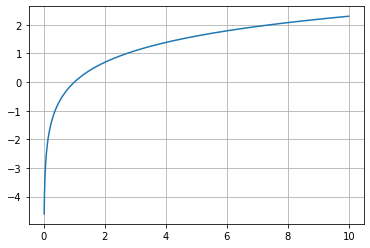
Log
import numpy as np
import matplotlib.pyplot as plt

x = np.arange(0, 10, 0.01)
y = np.log(x)

plt.grid()
plt.plot(x,y)
plt.show()
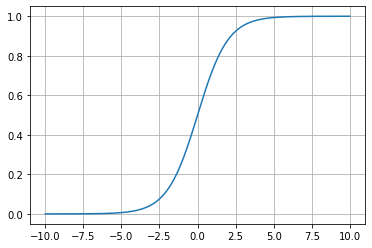
Sigmoid
import numpy as np
import matplotlib.pyplot as plt

x = np.arange(-10, 10, 0.01)
y = 1 / (1 + np.exp(-x))

plt.grid()
plt.plot(x,y)
plt.show()
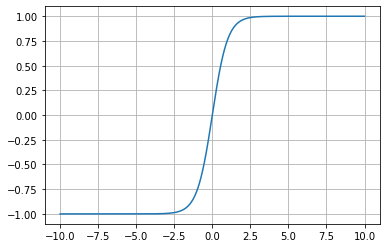
tanh
import numpy as np
import matplotlib.pyplot as plt

x = np.arange(-10, 10, 0.01)
y = (np.exp(x)-np.exp(-x))/(np.exp(x)+np.exp(-x))

plt.grid()
plt.plot(x,y)
plt.show()
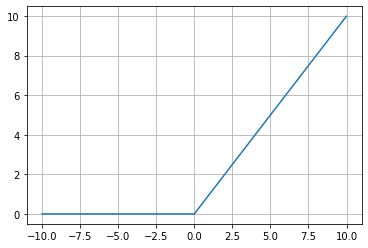
Relu
import numpy as np
import matplotlib.pyplot as plt

x = np.arange(-10, 10, 0.01)
y = np.maximum(0, x)

plt.grid()
plt.plot(x,y)
plt.show()