本稿について
.NETFramework4.6.2, C#7.3, WinForms環境にて、MSChartからの置き換えを狙って、OxyPlotを使用した際、調査したり困ったりしたポイントのまとめ。
WinForms以外、WPF等にも共通する部分が多いと思う。
使用しているOxyPlotはNuGetで手に入る、2016/09/12公開のもの。
サンプルコード内では、PlotModelオブジェクトをmodel、PlotViewオブジェクトをplotView、Seriesオブジェクトをseriesと表記する。
基本的な事項
チャートの表示を更新したい
model.InvalidatePlot(true);
チャートの拡大縮小や描画範囲の選択をリセットしたい
model.ResetAllAxes();
マウス操作としては、中ボタン(マウスホイール)をダブルクリックする。
https://qiita.com/7of9/items/4b2aee6f161bec39a757
コード中で透明色を指定するにはどうしたらいいか
WhiteやBlackといったように、色を名前指定するにはOxyColorsを用いる。
透明色はOxyColors.Transparentになる。
チャートが実線で囲われているのが気にいらない
model.PlotAreaBoarderThickness = new OxyThickness(0);
Axis
拡大縮小、表示範囲の変更を検知したい
AxisオブジェクトのAxisChanged, TransformChangedイベントを使用する。
現在表示している範囲の最大値、最小値はどのプロパティ?
AxisオブジェクトのAcutalMaximum, ActualMinimumプロパティ。
軸のスケールを対数にしたい
LogarithmicAxisクラスを使用する。
Series
折れ線グラフをスムージングしたい
LineSeriesオブジェクトのSmoothプロパティをtrueに。
http://shikaku-sh.hatenablog.com/entry/oxyplot-simple-usage
チャート中のデータ上のマウスクリックを検知したい
SeriesオブジェクトのMouseDownイベントを使用する。
Tracker (ToolTip)
チャート中のデータを左クリックすると表示される小さなウィンドウ(ToolTip)のことを、OxyPlotではTrackerと呼ぶ。
折れ線グラフ中、配置した点と点の間にTrackerを表示したくない
series.CanTrackerInterpolatePoints = false;
Trackerの表示に左クリックが必要だが、マウスカーソルが重なった時に表示してほしい
var controller = new PlotController();

controller.UnbindMouseDown(OxyMouseButton.Left);
controller.BindMouseEnter(PlotCommands.HoverSnapTrack);

plotView.Controller = controller;
Trackerに表示されるデータの書式を変更したい
SeriesオブジェクトのTrackerFormatStringプロパティを使用する。
http://shikaku-sh.hatenablog.com/entry/oxyplot-simple-usage
TrackerにSeriesやAxisのTitleやX,Yの値以外を表示したい
IDataPointProviderを実装するMyDataPoint型を用意し、SeriesオブジェクトのItemsSourceプロパティにMyDataPointの集合を与える。
すると、TrackerFormatStringプロパティの中で、MyDataPointのプロパティを呼び出せるようになる。
class MyDataPoint : IDataPointerProvider
{
    public double X { get; }
    public double Y { get; }
    public double XY => X * Y;

    public MyDataPoint(double x, double y) { X = x; Y = y; }
    public DataPoint GetDataPoint() => new DataPoint(X, Y);
}

var array = new MyDataPoint[100];
for (int i = 0; i < MyDataPoint.Length; i++)
    array[i] = new MyDataPoint(i, i * i);

seires.ItemsSource = array;
sereis.TrackerFormatString = "X = {X}, Y = {Y}, XY = {XY}";
Trackerの背景色を変更したい
WinForms環境の場合、ShowTrackerメソッド内でBackColor = Color.LightSkyBlueとなっているので、変えられないように思う。
他の環境ならどうにかなるかもね。
Trackerとか要らない。表示したくない
model.TrackerChanged += (sender, e) => plotView.HideTracker();
Annotation
チャート内に(グラフ以外の)線をひきたい。その線に説明用の文字列を配置したい
LineAnnotationクラスを使用する。
LineAnnotationのTextHorizontalAlignmentを変えても線の左側に文字列を配置できない
できないので、文字列配置用のPointAnnotationを併用することにした。
チャート内に四角形で強調された範囲を表示したい。その範囲に説明用の文字列を配置したい
RectangleAnnotationクラスを使用する。
文字列は常に四角形の中央に表示されるので、気にいらなければ、説明用の文字列はPointAnnotationで表示するとよい。
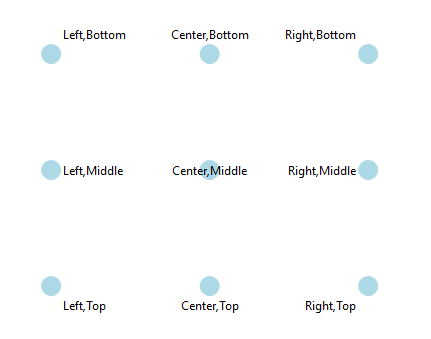
PointAnnotationのTextHorizontalAlignment,TextVerticalAlignmentが思ったように動作しない
Left, Bottomで点の右上に、Right, Topで点の左下に文字列が表示される。

その他
チャートの内容を画像として保存したい
PngExporterクラスを使用する。
var exporter = new PngExporter
{
    Width = plotView.Width,
    Height = plotView.Height,
    Background = OxyColors.White,
};
var bitmap = exporter.ExportToBitmap(model);
OxyPlot.Series.XYAxisSeries.GetNearestPointInternalメソッド内でArgumentNullExceptionが発生する
これ
https://github.com/oxyplot/oxyplot/issues/931
3年前にIssueとして登録されているがまだCloseされてないので、未対応なのでは。
これがどうにもならなくて、OxyPlotの使用自体をあきらめた。