はじめに

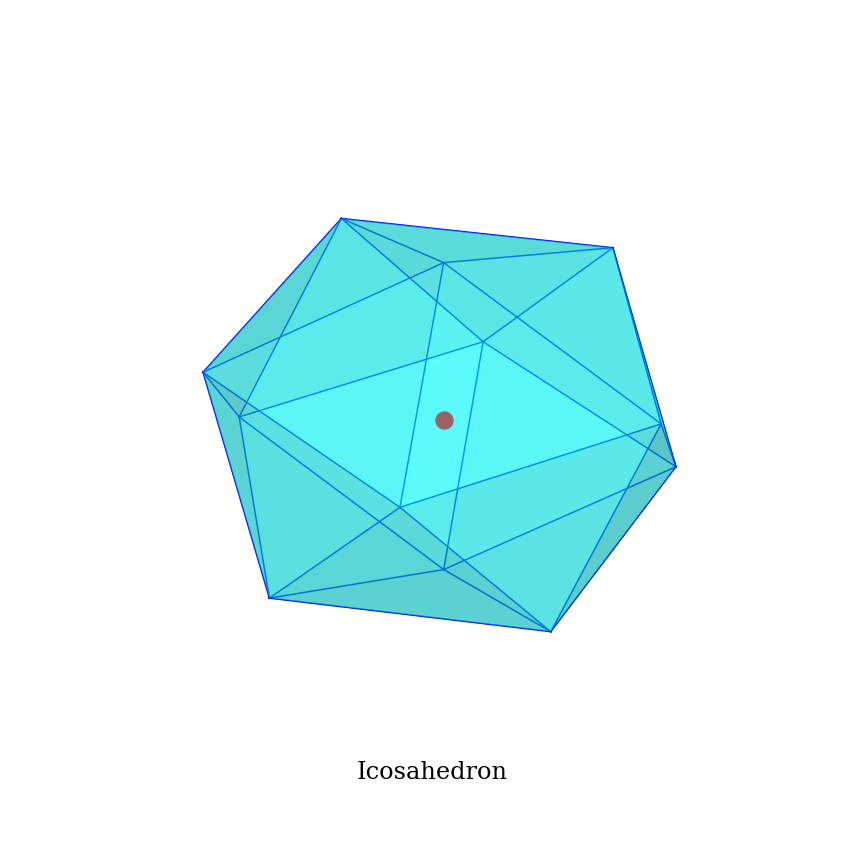
論文に載せられるレベルの綺麗な多面体の画像を、手軽に出力したいと思ったので自分でコードを書いてみました(コードを書くのは手軽じゃなかったですが笑)。
今回は、@ikiuo 様の「正多面体のデータを作る」で計算された多面体の座標などのデータを使って実際に正多面体をプロットしていきます。ただし、三角形で構成された多面体( 正四面体・正八面体・正二十体 )に限ってプロットするコードになります。正六面体と正十二面体のバージョンも時間があれば投稿します。
正多面体の描画は以下の関数で行います。
import numpy as np
import matplotlib.pyplot as plt
from matplotlib.colors import LightSource

def plot_polyhedron(ax, VERTEX, EDGE, FACET):

    #グラフの描画
    for i in range(len(EDGE)):
        coordinates = np.array([VERTEX[EDGE[i][0]], VERTEX[EDGE[i][1]]])
        x, y, z = coordinates.T
        ax.plot(x, y, z,markersize=6, color='blue', linewidth=1.5)


    ls = LightSource(40, 70) #光源の設定
    # 面の塗りつぶし
    for i in range(len(FACET)):
        coordinates = np.array([VERTEX[FACET[i][0]], VERTEX[FACET[i][1]], VERTEX[FACET[i][2]]])
        x, y, z = coordinates.T
        ax.plot_trisurf(x, y, z, alpha=0.4, antialiased=True, shade=True,lightsource=ls,  color='cyan')

    # 任意の点のプロット
    ax.scatter(0, 0, 0, color='red', s=300)


    ax.set_axis_off() # 座標の透明化
    ax.view_init(elev=40, azim=10) # 視点の設定

    ax.set_xlim(-1, 1)
    ax.set_ylim(-1, 1)
    ax.set_zlim(-1, 1)
    return ax
- LightSource関数について: matplotlib.colors.LightSource — Matplotlib 3.4.3 documentation
- plot_trisurf関数について:The mplot3d Toolkit — Matplotlib 3.4.3 documentation
解説
入力データ
まず、プログラムと出力結果のところから、好きな多面体のデータを丸っとコピーします。ここでは、例として正四面体の場合で行います。そのままでは使えないので、これらの配列をNumPyで扱うために修正して、以下のものを使います(データはコピペしてすぐ使える形式で最後にまとめて置いています)。
# 正四面体の情報
# 頂点
VERTEX = np.array([
       [ 0.      ,  0.      ,  1.      ], #0
       [ 0.942809,  0.      , -0.333333], #1
       [-0.471405,  0.816497, -0.333333], #2
       [-0.471405, -0.816497, -0.333333]  #3
])
# 面と法線ベクトルと、面を構成する頂点
FACET = np.array([
       [2, 0, 1], #0
       [3, 0, 2], #1
       [3, 1, 0], #2
       [3, 2, 1]  #3
])
# 辺を構成する頂点
EDGE = np.array([
       [0, 1],
       [1, 2],
       [2, 0],
       [2, 3],
       [3, 0],
       [3, 1]
])
Matplotlibで出力
# アスペクト比は1:1にするのがおすすめです。
fig = plt.figure(figsize = (12, 12))

ax = fig.add_subplot(1,1,1, projection='3d')
ax = plot_polyhedron(ax, VERTEX, EDGE, FACET)
ax.set_title(r"Tetrahedron", y=0.1, size=24)
plt.show()
データ置き場
コードまとめ
import numpy as np
import matplotlib.pyplot as plt
from matplotlib.colors import LightSource

def plot_polyhedron(ax, VERTEX, EDGE, FACET):

    #グラフの描画
    for i in range(len(EDGE)):
        coordinates = np.array([VERTEX[EDGE[i][0]], VERTEX[EDGE[i][1]]])
        x, y, z = coordinates.T
        ax.plot(x, y, z,markersize=6, color='blue', linewidth=1.5)


    ls = LightSource(40, 70) #光源の設定
    # 面の塗りつぶし
    for i in range(len(FACET)):
        coordinates = np.array([VERTEX[FACET[i][0]], VERTEX[FACET[i][1]], VERTEX[FACET[i][2]]])
        x, y, z = coordinates.T
        ax.plot_trisurf(x, y, z, alpha=0.4, antialiased=True, shade=True,lightsource=ls,  color='cyan')

    # 任意の点のプロット
    ax.scatter(0, 0, 0, color='red', s=300)


    ax.set_axis_off() # 座標の透明化
    ax.view_init(elev=40, azim=10) # 視点の設定

    ax.set_xlim(-1, 1)
    ax.set_ylim(-1, 1)
    ax.set_zlim(-1, 1)
    return ax

# アスペクト比は1:1にするのがおすすめです。
fig = plt.figure(figsize = (12, 12))

ax = fig.add_subplot(1,1,1, projection='3d')
ax = plot_polyhedron(ax, VERTEX, EDGE, FACET)
ax.set_title(r"Tetrahedron", y=0.1, size=24)
plt.show()
正四面体の情報
# 正四面体の情報
# 頂点
VERTEX = np.array([
       [ 0.      ,  0.      ,  1.      ], #0
       [ 0.942809,  0.      , -0.333333], #1
       [-0.471405,  0.816497, -0.333333], #2
       [-0.471405, -0.816497, -0.333333]  #3
])
# 面と法線ベクトルと、面を構成する頂点
FACET = np.array([
       [2, 0, 1], #0
       [3, 0, 2], #1
       [3, 1, 0], #2
       [3, 2, 1]  #3
])
# 辺を構成する頂点
EDGE = np.array([
       [0, 1],
       [1, 2],
       [2, 0],
       [2, 3],
       [3, 0],
       [3, 1]
])
正八面体の情報
# 正八面体の情報
VERTEX= np.array([
       [ 0.,  0.,  1.], #0
       [ 1.,  0.,  0.], #1
       [ 0.,  1.,  0.], #2
       [-1.,  0.,  0.], #3
       [-0., -1.,  0.], #4
       [ 0., -0., -1.]  #5
])
FACET = np.array([
       [2, 0, 1], #0
       [3, 0, 2], #1
       [4, 0, 3], #2
       [4, 1, 0], #3
       [5, 1, 4], #4
       [5, 2, 1], #5
       [5, 3, 2], #6
       [5, 4, 3]  #7
])
EDGE = np.array([
       [0, 1],
       [1, 2],
       [2, 0],
       [2, 3],
       [3, 0],
       [3, 4],
       [4, 0],
       [4, 1],
       [4, 5],
       [5, 1],
       [5, 2],
       [5, 3]
])
正二十面体の情報
# 正二十面体の情報
VERTEX = np.array([ #12
  [ +0.000000, +0.000000, +1.000000 ],  #0
  [ +0.894427, +0.000000, +0.447214 ],  #1
  [ +0.276393, +0.850651, +0.447214 ],  #2
  [ -0.723607, +0.525731, +0.447214 ],  #3
  [ -0.723607, -0.525731, +0.447214 ],  #4
  [ +0.276393, -0.850651, +0.447214 ],  #5
  [ +0.723607, -0.525731, -0.447214 ],  #6
  [ +0.723607, +0.525731, -0.447214 ],  #7
  [ -0.276393, +0.850651, -0.447214 ],  #8
  [ -0.894427, -0.000000, -0.447214 ],  #9
  [ -0.276393, -0.850651, -0.447214 ],  #10
  [ -0.000000, +0.000000, -1.000000 ],  #11
])

FACET = np.array([ #20
  ( +0.491123, +0.356822, +0.794654 ), (  2,  0,  1 ),  #0
  ( -0.187592, +0.577350, +0.794654 ), (  3,  0,  2 ),  #1
  ( -0.607062, +0.000000, +0.794654 ), (  4,  0,  3 ),  #2
  ( -0.187592, -0.577350, +0.794654 ), (  5,  0,  4 ),  #3
  ( +0.491123, -0.356822, +0.794654 ), (  5,  1,  0 ),  #4
  ( +0.794654, -0.577350, +0.187592 ), (  6,  1,  5 ),  #5
  ( +0.982247, -0.000000, -0.187592 ), (  7,  1,  6 ),  #6
  ( +0.794654, +0.577350, +0.187592 ), (  7,  2,  1 ),  #7
  ( +0.303531, +0.934172, -0.187592 ), (  8,  2,  7 ),  #8
  ( -0.303531, +0.934172, +0.187592 ), (  8,  3,  2 ),  #9
  ( -0.794654, +0.577350, -0.187592 ), (  9,  3,  8 ),  #10
  ( -0.982247, -0.000000, +0.187592 ), (  9,  4,  3 ),  #11
  ( -0.794654, -0.577350, -0.187592 ), ( 10,  4,  9 ),  #12
  ( -0.303531, -0.934172, +0.187592 ), ( 10,  5,  4 ),  #13
  ( +0.303531, -0.934172, -0.187592 ), ( 10,  6,  5 ),  #14
  ( +0.187592, -0.577350, -0.794654 ), ( 11,  6, 10 ),  #15
  ( +0.607062, +0.000000, -0.794654 ), ( 11,  7,  6 ),  #16
  ( +0.187592, +0.577350, -0.794654 ), ( 11,  8,  7 ),  #17
  ( -0.491123, +0.356822, -0.794654 ), ( 11,  9,  8 ),  #18
  ( -0.491123, -0.356822, -0.794654 ), ( 11, 10,  9 ),  #19
])

EDGE = np.array([
  [  0,  1], [  1,  2], [  2,  0], [  2,  3],
  [  3,  0], [  3,  4], [  4,  0], [  4,  5],
  [  5,  0], [  5,  1], [  5,  6], [  6,  1],
  [  6,  7], [  7,  1], [  7,  2], [  7,  8],
  [  8,  2], [  8,  3], [  8,  9], [  9,  3],
  [  9,  4], [  9, 10], [ 10,  4], [ 10,  5],
  [ 10,  6], [ 10, 11], [ 11,  6], [ 11,  7],
  [ 11,  8], [ 11,  9],
])

FACET=FACET[1::2].astype(int)
References
