概要
- Qiita Advent Calendarのカレンダー数と参加者数をグラフで可視化してみました。
前準備
import urllib.request as req
from bs4 import BeautifulSoup
import matplotlib.pyplot as plt
# スクレイピング
url = "https://qiita.com/advent-calendar"
res = req.urlopen(url)
bs = BeautifulSoup(res, "html.parser")
all_list = [] # 年数、カレンダー数、参加者数を入れるリスト
for i in bs.select("div.container"):
for j in i.select("div.row.adventCalendarYearList_element"):
temp = [k.get_text() for k in j.find_all("dd")]
temp.insert(0,j.find("div").get_text())
all_list.append(temp)
all_list.reverse() # 年数を昇順にソート
# 年数
year_list = [i[0] for i in all_list]
# カレンダー数
carender_list = [int(i[1]) for i in all_list]
# 参加者数
participant_list = [int(i[2]) for i in all_list]
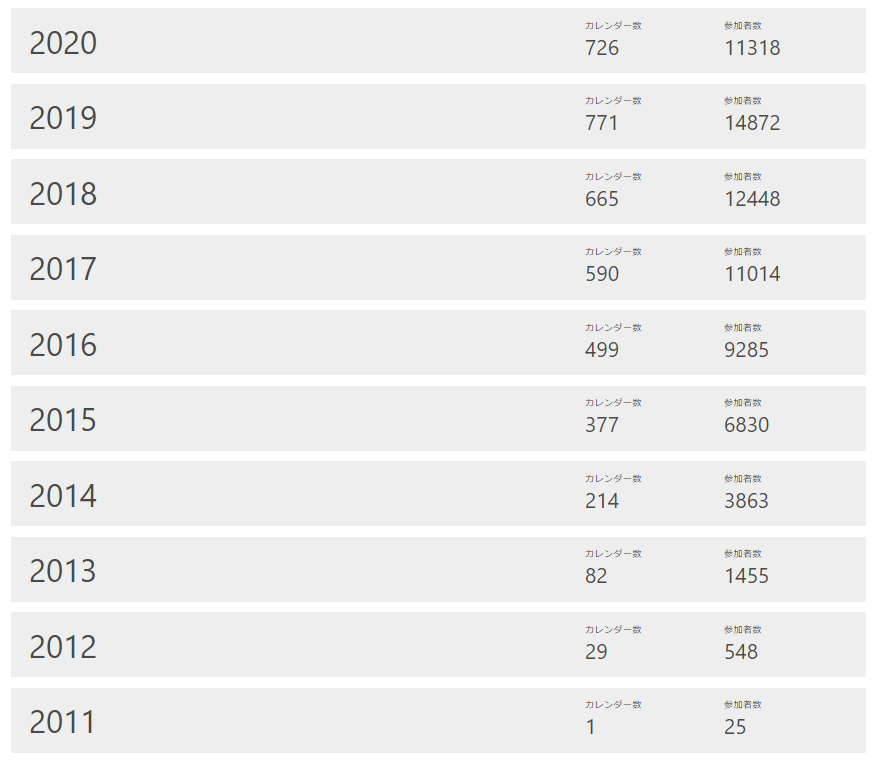
# 実行結果
print(year_list)
print(carender_list)
print(participant_list)
- 実行結果
['2011', '2012', '2013', '2014', '2015', '2016', '2017', '2018', '2019', '2020']
[1, 29, 82, 214, 377, 499, 590, 665, 771, 726]
[25, 548, 1455, 3863, 6830, 9285, 11014, 12448, 14872, 11318]
- ちゃんと年数と人数を取得できている
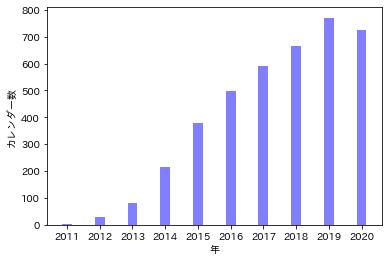
カレンダー数と年数のグラフ
# カレンダー数と年数のグラフ
plt.bar(year_list,carender_list, color='b', width=0.3, alpha=0.5)
plt.ylabel("カレンダー数")
plt.xlabel("年")
plt.show()
- グラフ
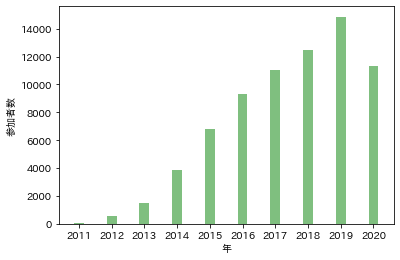
参加者数と年数のグラフ
# 参加者数と年数のグラフ
plt.bar(year_list,participant_list, color='g', width=0.3, alpha=0.5)
plt.ylabel("参加者数")
plt.xlabel("年")
plt.show()
- グラフ
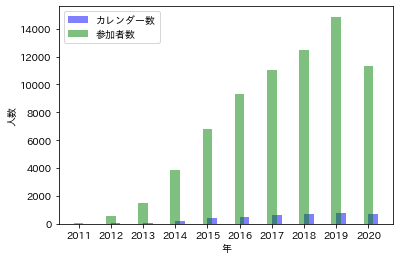
カレンダー数と参加者数をまとめたグラフ
# カレンダー数と参加者数をまとめたグラフ
plt.bar(year_list,carender_list, color='b', width=0.3, label='カレンダー数', alpha=0.5, align="edge")
plt.bar(year_list,participant_list, color='g', width=0.3, label='参加者数', alpha=0.5, align="center")
plt.ylabel("人数")
plt.xlabel("年")
plt.legend()
- グラフ
まとめ
- 年々と人数が増えてきている!
- 今年は去年の人数を超えることを期待!
全体のコード
import urllib.request as req
from bs4 import BeautifulSoup
import matplotlib.pyplot as plt

# スクレイピング
url = "https://qiita.com/advent-calendar"
res = req.urlopen(url)
bs = BeautifulSoup(res, "html.parser")

all_list = [] # 年数、カレンダー数、参加者数を入れるリスト
for i in bs.select("div.container"):
    for j in i.select("div.row.adventCalendarYearList_element"):
        temp = [k.get_text() for k in j.find_all("dd")]
        temp.insert(0,j.find("div").get_text())
        all_list.append(temp)

all_list.reverse() # 年数を昇順にソート

# 年数
year_list = [i[0] for i in all_list]
# カレンダー数
carender_list = [int(i[1]) for i in all_list]
# 参加者数
participant_list = [int(i[2]) for i in all_list]

# 実行結果
print(year_list)
print(carender_list)
print(participant_list)

# カレンダー数と年数のグラフ
plt.bar(year_list,carender_list, color='b', width=0.3, alpha=0.5)
plt.ylabel("カレンダー数")
plt.xlabel("年")
plt.show()

# 参加者数と年数のグラフ
plt.bar(year_list,participant_list, color='g', width=0.3, alpha=0.5)
plt.ylabel("参加者数")
plt.xlabel("年")
plt.show()

# カレンダー数と参加者数をまとめたグラフ
plt.bar(year_list,carender_list, color='b', width=0.3, label='カレンダー数', alpha=0.5, align="edge")
plt.bar(year_list,participant_list, color='g', width=0.3, label='参加者数', alpha=0.5, align="center")
plt.ylabel("人数")
plt.xlabel("年")
plt.legend()