これはちゅらデータアドベントカレンダー 14日目の記事です。6日目ではゴリゴリ数学の記事だったので、軽いものを書きます。
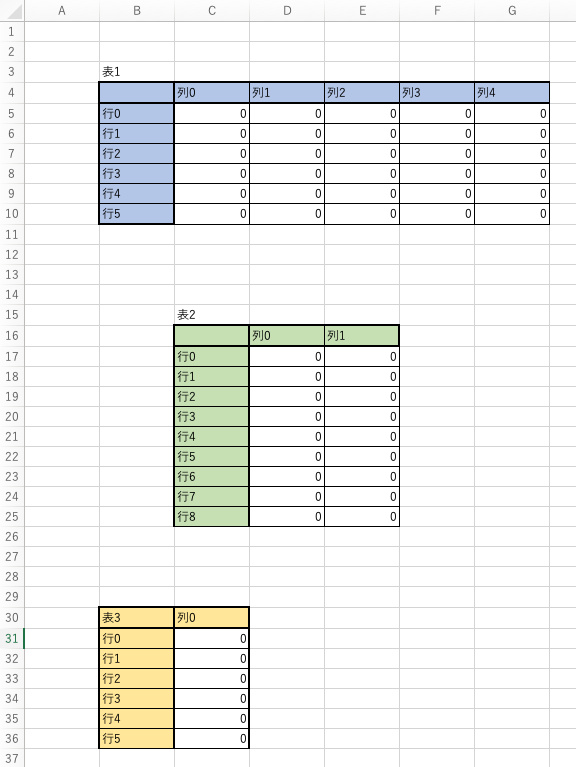
以下のように、Excel ファイルに複数の表が含まれている場合にひとつひとつ表を切り出す関数を書いたのでメモしておきます。パワータイプの実装なのであんまし綺麗じゃないかもですが、ご参考までに。
def cut_sheet(df, s, search_column=False):
    """
    シートから特定の文字列で始まる表を取得
    :param DataFrame df: 複数の表を含んだデータフレーム
    :param str s: 表の左上端に位置する文字列
    :param bool search_column: s が column 行にあるか
    :return DataFrame df_cut: 切り取った表のデータフレーム
    """
    # s のいる位置を特定
    stacked_df = df.stack()
    location = stacked_df[stacked_df == s].index.to_list()[0]
    # s を左上端とした表を切り出す
    start_index = df.index.to_list().index(location[0]) + 1 -int(search_column)
    start_column = df.columns.to_list().index(location[1])
    df_cut_ = df.iloc[start_index+1:, start_column:].reset_index(drop=True)
    columns = df.iloc[start_index, start_column:]
    if (columns[0] != columns[0]):
        columns[0] = s
    df_cut_.columns = [
        int(column)
        if ((type(column) is float) & (column == column))
        else column
        for column
        in columns
    ]
    df_cut_.set_index(columns[0], inplace=True)

    # 行の終わりを探す
    exists_indexes = df_cut_.iloc[:,0].isna().to_list()
    if (True in exists_indexes):
        end_index = exists_indexes.index(True)
    # 下端に達する表については下端を終端とする
    else:
        end_index = len(exists_indexes)

    # 列の終わりを探す
    use_columns = [column for column in df_cut_.columns if column == column]
    df_cut = df_cut_.iloc[:int(end_index), :][use_columns]

    return df_cut
少々強引ですが、これで表が取り出せます。
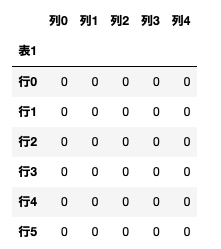
cut_sheet(sheet, '表1', search_column=False)
cut_sheet(sheet, '表3', search_column=True)
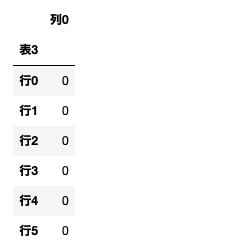
やったね。