はじめに
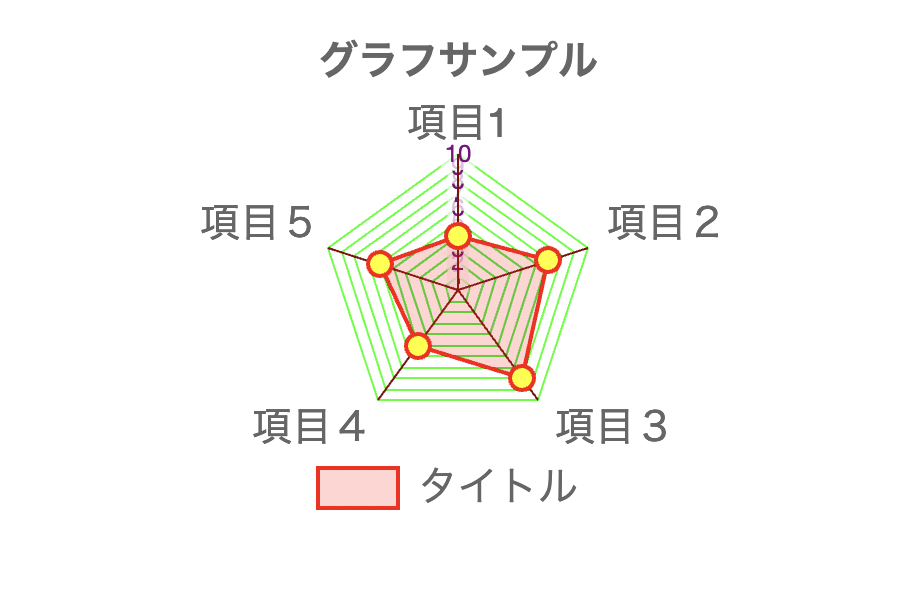
colabでグラフを作成できたけど、flask上に表示までができない、、、という人も多いのではないでしょうか?
今回はそういった人に向けて、chart.jsを使ってPythonで扱ったデータをブラウザ上でグラフ表示する方法を紹介します!
JS
まず、staticフォルダの中にjsフォルダを作成し、そこにgraph.jsファイルを作成しましょう!
そしてこちらのコードをそのままコピペしてください!
graph.js
let title = document.getElementById('chart_title').value;
let target = document.getElementById('chart_target').value;
let dstr = String(document.getElementById('chart_data').value);
let darr = dstr.split(',');
let dlabel = String(document.getElementById('chart_labels').value);
let larr = dlabel.split(',');
let ctx = document.getElementById('myChart').getContext('2d');
let myRadarChart = new Chart(ctx, {
    type: 'radar',
    data: {
        labels: larr,
        datasets: [{
            data:darr,//app.pyのchart_data
            backgroundColor: "rgba(255,0,0,0.2)", // 線の下の塗りつぶしの色
            borderColor: "red",                   // 線の色
            borderWidth: 2,                       // 線の幅
            pointStyle: "circle",                 // 点の形状
            pointRadius: 6,                       // 点形状の半径
            pointBorderColor: "red",              // 点の境界線の色
            pointBorderWidth: 2,                  // 点の境界線の幅
            pointBackgroundColor: "yellow",       // 点の塗りつぶし色
            pointLabelFontSize: 20,
            label: target //app.pyのchart_target
            }
        ]
    },
    options: {
        responsive: true,
        title: {                // タイトル
            display: true,      // 表示する
            fontSize: 20,       // タイトルのフォント
            text: title         //app.pyのchart_title
        },
        legend: {
            position: 'bottom', // 凡例の表示位置
            labels: {
                fontSize: 20,   // 判例のフォントサイズ
            },
        },
        scale: {
            // スケールを隠す。
            display: true,      // メモリを表示する
            ticks: {            // 目盛り
                min: 0,         // 目盛りの最小値
                max: 10,        // 目盛りの最大値
                stepSize: 1,    // 目盛の間隔
                fontSize: 12,   // 目盛り数字の大きさ
                fontColor: "purple"  // 目盛り数字の色
            },
            pointLabels: {
                fontSize: 20    // チャートラベルのフォントサイズ
            },
            angleLines: {        // 軸(放射軸)
                display: true,
                color: "maroon"
            },
            gridLines: {         // 補助線(目盛の線)
                display: true,
                color: "lime"
            }
        },
    }
});
Python
Flaskファイルに以下を記入します
app.py
import os
from flask import (
     Flask,
     request,
     render_template)
app = Flask(__name__)

@app.route('/graph')
def chart_do():
    c = {
        'chart_labels': "項目1, 項目2, 項目3, 項目4,項目5",
        'chart_data': "4, 7, 8, 5, 6",
        'chart_title': "グラフサンプル",
        'chart_target': "タイトル"
    }
    return render_template('graph.html', c=c)

if __name__ == "__main__":
  app.run(debug=True)
これが大事です!↓
chart_data: →ここにグラフに入れたいデータを配列と似たような形で渡します!←
HTML
base.html
<!DOCTYPE html>
<html lang="ja">
   <head>
        <meta charset="utf-8">
        <meta http-equiv="X-UA-Compatible" content="IE=edge">
        <meta name="viewport" content="width=device-width, initial-scale=1, shrink-to-fit=no">
        <link rel="stylesheet" href="../static/css/style.css">
        <link rel="stylesheet" href="https://cdn.jsdelivr.net/npm/bootstrap@4.5.3/dist/css/bootstrap.min.css" integrity="sha384-TX8t27EcRE3e/ihU7zmQxVncDAy5uIKz4rEkgIXeMed4M0jlfIDPvg6uqKI2xXr2" crossorigin="anonymous">
        {% block header %}
    	{% endblock %}
        <title>Graph Sample</title>
  </head>
  <body>
    <div class="container">
	    {% block content %}
	    {% endblock %}
    </div>
  </body>
</html>
graph.html
{% extends 'base.html' %}

{% block header %}
<script src="https://cdnjs.cloudflare.com/ajax/libs/Chart.js/2.7.1/Chart.min.js"></script>
{% endblock %}

{% block content %}
  <div class="container">
      <div class="row my-4">
          <canvas id="myChart"></canvas>
      </div>
      <input type="hidden" id="chart_labels" name="chart_labels" value="{{ c.chart_labels }}">
      <input type="hidden" id="chart_title" name="chart_title" value="{{ c.chart_title }}">
      <input type="hidden" id="chart_target" name="chart_target" value="{{ c.chart_target }}">
      <input type="hidden" id="chart_data" name="chart_data" value="{{ c.chart_data }}">
  </div>
      <script type="text/javascript" src="static/js/graph.js"></script>
{% endblock %}
最後に
いかがでしたでしょうか?
何か不明点や編集点などありましたらご連絡ください。
参考記事
グッラフの形状を変えたい場合こちらを参照ください!
https://www.chartjs.org/docs/latest/
