概要
PythonでPowerPointの資料を自動作成する方法について紹介します。
※ 結論から言うとpython-pptx というライブラリを使用します。
自分のようなPython初心者向けのサンプルコードを載せています。
前提条件
下記のバージョンで動作を確認しました。
Python : 3.7
python-pptx : 0.6.18
PowerPoint2016
対象とする人
- 仕事や学業、研究などで、データ解析、データの可視化をしている人
- 可視化したグラフや表などをPowerPointに貼り付けて、報告資料を作成している人
- ※特に、毎回同じ形式のレポートを作成していて「無駄多いでぇ……」と感じている、
本質的でない作業に多くの時間を取られていると感じている人
準備
インストール
pip install python-pptx
テンプレート用pptxファイルの準備
使用する書式等をスライドマスターに設定したファイルを読み込むと、その設定を流用することができます。
今回はtemplate.pptxというファイルを準備し、実行ファイルと同じ階層に入れておきます。
- template.pptxの「表示」タブ→「スライドマスター」を編集することで、タイトルの位置やフォント、ヘッダーやフッターなどをまとめて変更できます。
template.pptx

グラフ等の画像の準備
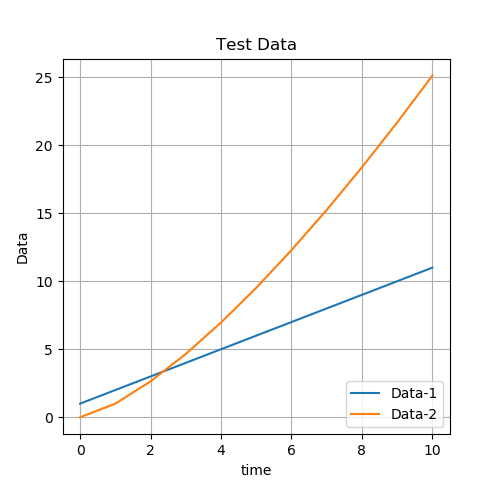
今回のサンプルコードではpythonでグラフ化したデータの例として、下記の画像を使用しました。
graph.png
サンプルコード
- コードの構成
- import
- スライド上でcm単位の指定をするための関数
- テンプレート/出力ファイルの設定
- 空スライドの挿入
- タイトルの設定
- image(グラフ等)の挿入
- tableの挿入
- テキストボックスの挿入
- pptxファイル出力
# coding: UTF-8

from pptx import Presentation
from pptx.util import Pt, Inches
from pptx.dml.color import RGBColor

# センチメートルをPowerPoint上の距離に変換する関数
def Centis(length):
    centi = Inches(length/2.54)
    return centi


# ---------------------------------------------------
"テンプレート、出力ファイル名の設定"
# ---------------------------------------------------
# templateとなるpptxファイルを指定する。
template_path = "./template.pptx"
# 出力するpptxファイルを指定する。(存在しない場合、自動作成されます)
save_path = "./output.pptx"


# ---------------------------------------------------
"空のスライドの挿入"
# ---------------------------------------------------
presentation = Presentation(template_path)
title_slide_layout = presentation.slide_layouts[1]  # レイアウトや書式を元ファイルから参照する
slide = presentation.slides.add_slide(title_slide_layout)
shapes = slide.shapes


# ---------------------------------------------------
"タイトルテキストの挿入"
# ---------------------------------------------------
# 入力したい文字列
slide_title = "TEST TITLE"
shapes.title.text = slide_title


# ---------------------------------------------------
"imageの挿入"
# ---------------------------------------------------
# 挿入する位置
pic_left = Centis(1)
pic_top = Centis(5)

# imageの高さを指定
pic_height = Centis(7.9)

image_path = "./graph.png"
slide.shapes.add_picture(image_path, pic_left, pic_top, height=pic_height)


# ---------------------------------------------------
"tableの挿入"
# ---------------------------------------------------
# 入力したいtable状のデータ
sample_table = [ ["1.1","1.2","1.3"]
                ,["2.1","2.2","2.3"]
                ,["3.1","3.2","3.3"]]

# cell内のフォントサイズ
cell_font = 20

# 挿入する位置
table_left = Centis(9.4)
table_top = Centis(5)

# tableの幅と高さ(仮)
table_width = Centis(15)
table_height = Centis(10)

# tableの行数と列数(tableのサイズ)
rows = len(sample_table)
cols = len(sample_table[0])

table = slide.shapes.add_table(rows, cols, table_left, table_top, table_width, table_height).table

# 表の各セルの中身を記入
for i in range(rows):
    for j in range(cols):
        cell = table.cell(i, j)
        cell.text = sample_table[i][j]
        cell.text_frame.paragraphs[0].font.size = Pt(cell_font)

# tableの高さを再調整
table.rows[0].height = Centis(1.5)
table.rows[1].height = Centis(4.9)
table.rows[2].height = Centis(1.5)

# tableの幅を再調整
table.columns[0].width = Centis((15) / 3)
table.columns[1].width = Centis((15) / 3)
table.columns[2].width = Centis((15) / 3)


# ---------------------------------------------------
"テキストボックスの挿入"
# ---------------------------------------------------
# 文字列
sample_str = "Test Text"

# テキストボックスの位置
text_left = Centis(1)
text_top = Centis(13.4)

# テキストボックスの幅と高さ
text_width = Centis(25.4-2)
text_height = Centis(5)

# 文字のフォントサイズ
text_font = 20

# 塗りつぶし色指定(R, G, B)
color = RGBColor(150, 255, 255)

text_box = slide.shapes.add_textbox(text_left, text_top, text_width, text_height)

text_box.text = sample_str
text_box.text_frame.add_paragraph().font.size = Pt(text_font)
text_box.fill.solid()
text_box.fill.fore_color.rgb = color


# ---------------------------------------------------
"ファイル保存"
# ---------------------------------------------------
presentation.save(save_path)
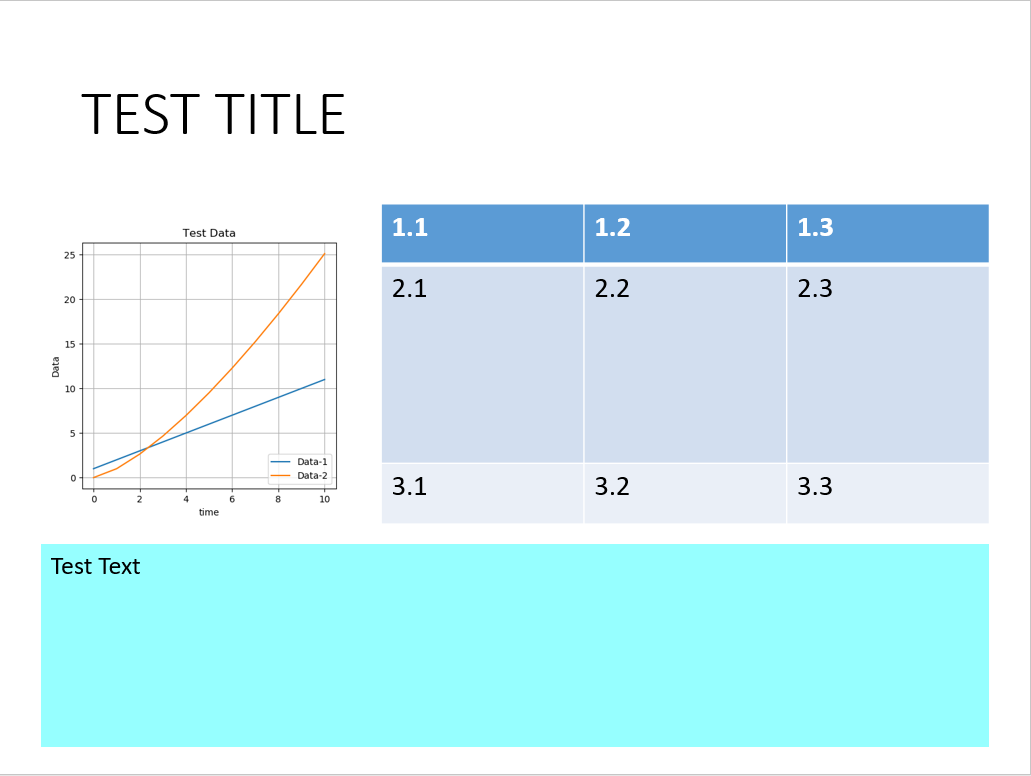
実行結果
上記サンプルコードを実行すると、下記のようなスライド(output.pptx)が作成されます。
補足
- スライド中の位置の指定は、左上を原点(0)として指定します。下記図を参考にしてください。

-
slide = presentation.slides.add_slide(title_slide_layout)~から下の文、スライドの挿入と要素の挿入をfor文等で回すことで、複数のスライドを作ることも可能です。 -
PowerPoint内のグラフ描画機能を利用することもできるらしいのですが、個人的には、matplotlib等で作図したものの方が見やすいので、save fig等でimage化 ⇒ 画像として貼り付けのstepを踏んでいます。
最後に
今回はPowerPointの自動作成として、python-pptxというライブラリを紹介しました。
現状はサンプルコードのみですが、極力どこで何をしているか分かりやすく記述したつもりです。
このコードは自由に流用・改造していただいてかまいません。
また、データ解析⇒グラフ化するコードと今回の内容を組み合わせることで、
レポート作成までを全自動化することも可能になります。ぜひ試してみて下さい。
本質的でない作業はどんどん自動化しましょう!
参考
公式ドキュメント
https://python-pptx.readthedocs.io/en/latest/index.html#
参考にさせていただいた先行文献
https://qiita.com/pocket8137/items/3d8fda2c47664bf9130b
https://qiita.com/code_440/items/22e8539da465686496d3