こんにちは! kouです。
今日は、vscodeでxdebugを使うために注意すべきことについて説明します!
この記事は、Visual Studio CodeでPHPをデバッグする方法に、補足を加えたものです
実施環境
- windows10
- visual studio code(以下vs code)が、インストール済み
- xamppがC:直下にインストール済み
- Visual Studio CodeでPHPをデバッグする方法を読んで手順4までが完了している
lunch.jsonファイル
実行したいファイルがあるフォルダーを開き、実行したいファイルを選択>左メニューバーからデバッグボタンをクリック
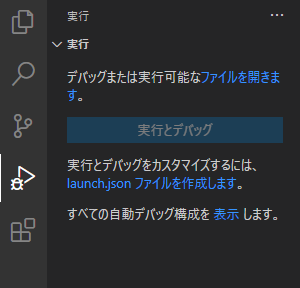
"launch.jsonファイルを作成します"をクリックし、PHPを選択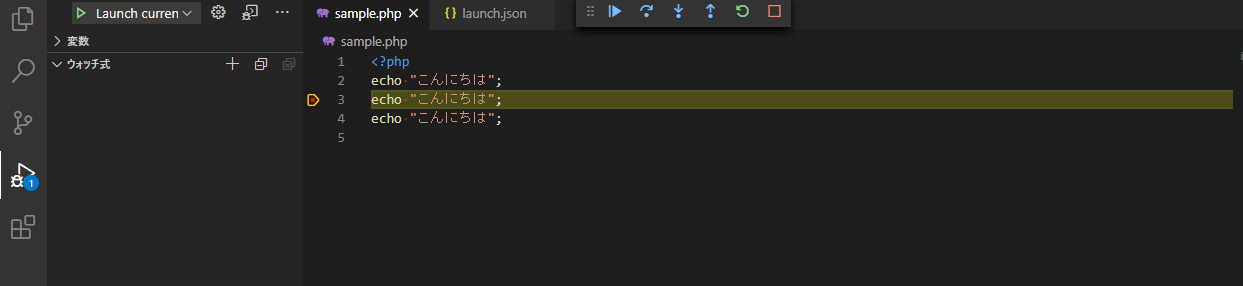
launch.jsonに、["runtimeExecutable": "C:\xampp\php\php.exe"]という行を追加し、下記のように修正。"runtimeExecutable"パスには、php.exeのpathを入力
*修正後
lunch.json
{
    "version": "0.2.0",
    "configurations": [
        {
            "name": "Listen for XDebug",
            "type": "php",
            "request": "launch",
            "port": 9000
        },
        {
            "name": "Launch currently open script",
            "type": "php",
            "request": "launch",
            "program": "${file}",
            "cwd": "${fileDirname}",
            "port": 9000,
            "runtimeExecutable": "C:\\xampp\\php\\php.exe"
        }
    ]
}
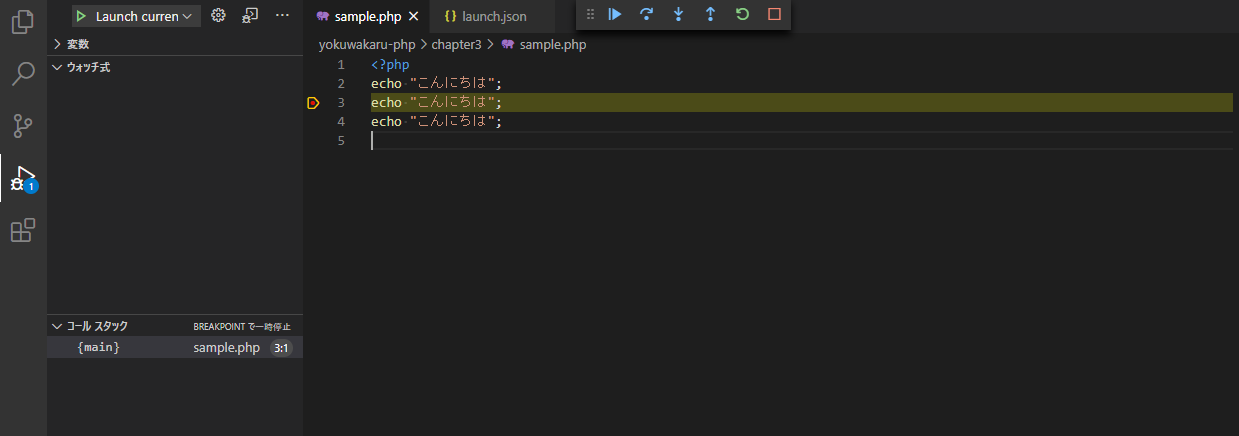
デバックの方法1-Webサーバーを使わないでデバック
「Launch currently open script」が選択されていることを確認し、デバック開始ボタンを押す
デバックの方法2-Webサーバーからデバック
xmappで、Actions>Start からapacheを起動し、adminをクリック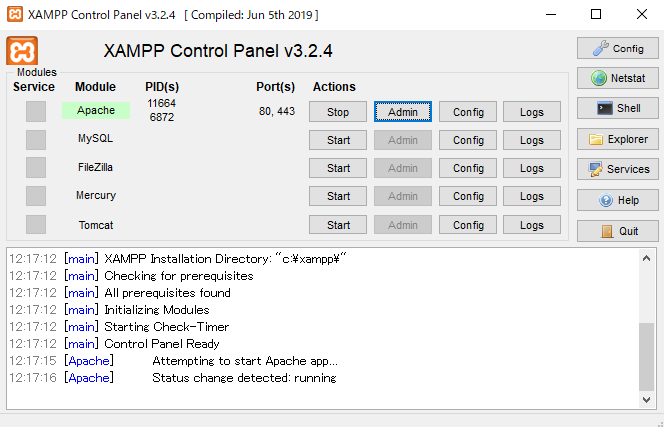
すると、このような画面が開く
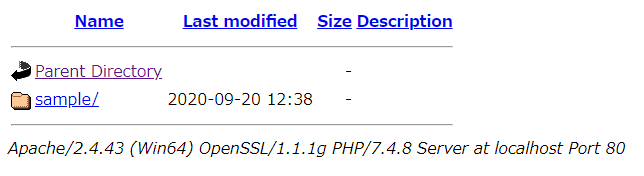
そこで、vscode上で、左サイドバー>listen for XDebugをクリック
その状態でapache上から実行したいファイルを開くと、デバッグができる