実施環境
- Windows10
- Visual Studio Code 1.37.1(以下VSCode)がインストール済
- xamppがC直下にインストール済(PHP 7.3.7)
手順
- VSCode設定ファイル追記
- VSCode拡張機能「PHP Debug」のインストール
- PHPデバッグツール「XDebug」のインストール
- 「XDebug」をVSCodeに紐づけ
- デバッグを行う
1. VSCode設定ファイル追記
VSCodeを立ち上げ
ファイル>基本設定>「settings.json」を検索>「settings.jsonで編集」をクリック
JSONファイルに以下の内容を追記します。
"php.validate.executablePath": "C:\\xampp\\php\\php.exe"
"php.validate.run": "onType"
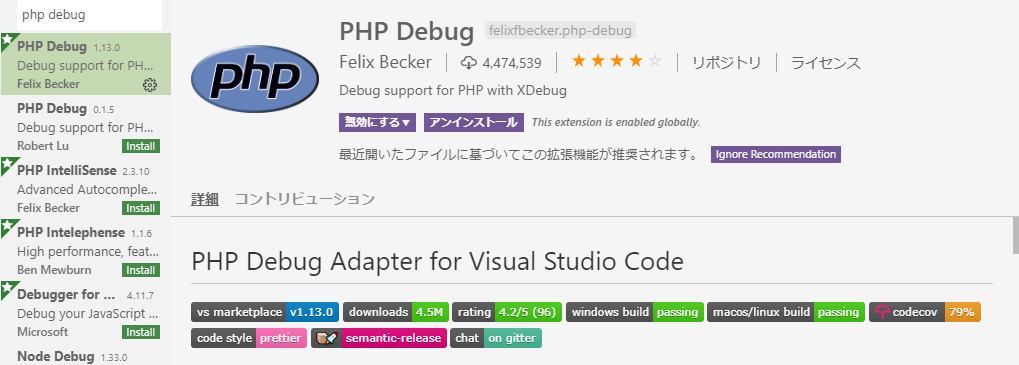
2. VSCode拡張機能「PHP Debug」のインストール
Ctrl + Shift + X で拡張機能検索ウィンドウを開きます。
「PHP Debug」と入力するとパッケージが表示されるので「インストール」をクリックします。
ボタンが「アンインストール」になったら成功。
3. PHPデバッグツール「XDebug」のインストール
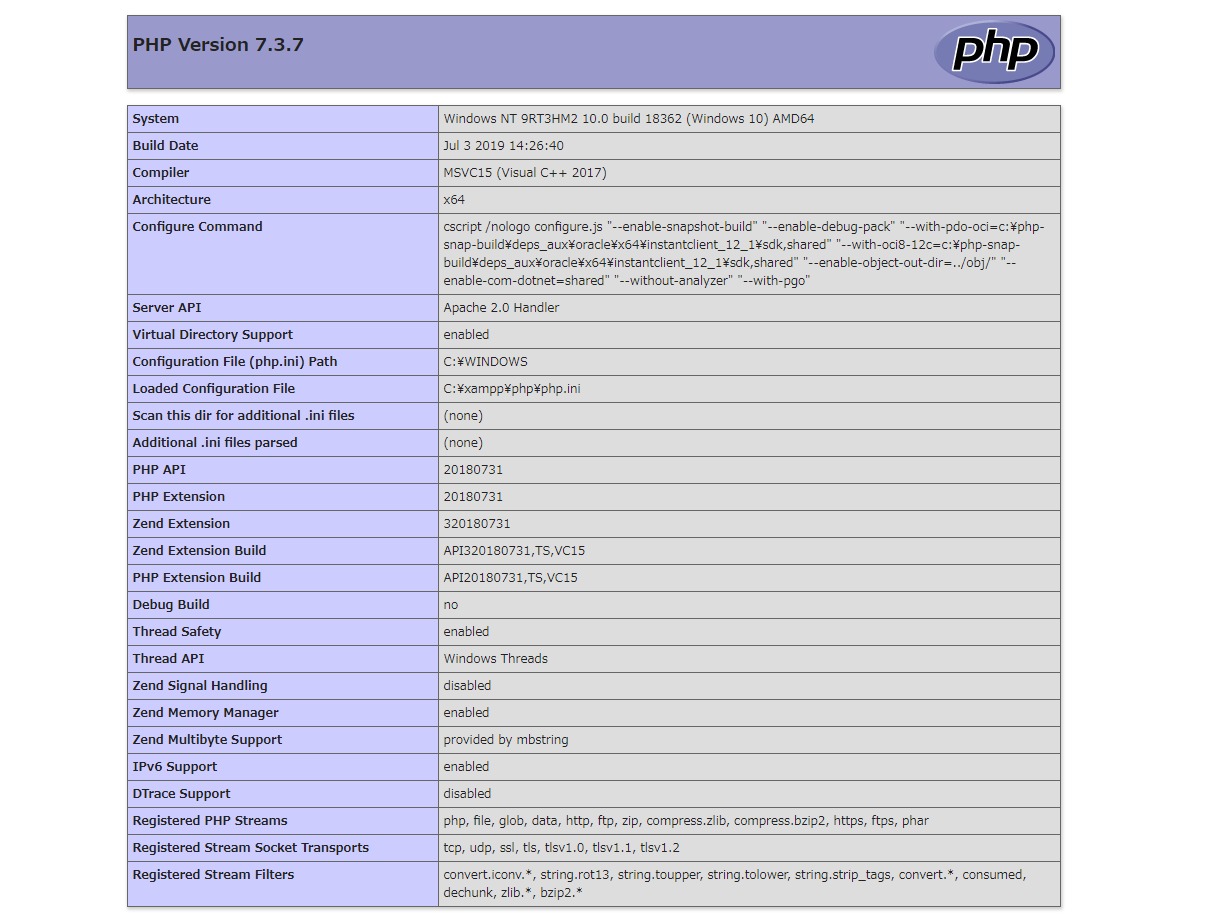
C:\xampp\htdocsの階層にphpinfo.phpというファイルを作成し、以下のコードを記述。
<?php
	phpinfo();
?>
xamppのコントロールパネルを開き、Apacheを起動。
C:\xampp\xampp-control.exe
起動後、http://localhost/phpinfo.php にアクセスすると下記のような画面が表示されるので、Ctrl + A で全文コピー。
https://xdebug.org/wizard.php を開き、テキストボックスに貼り付け。
Analyse my phpinfo() outputボタンをクリックし、表示されたDLLファイルをダウンロード。
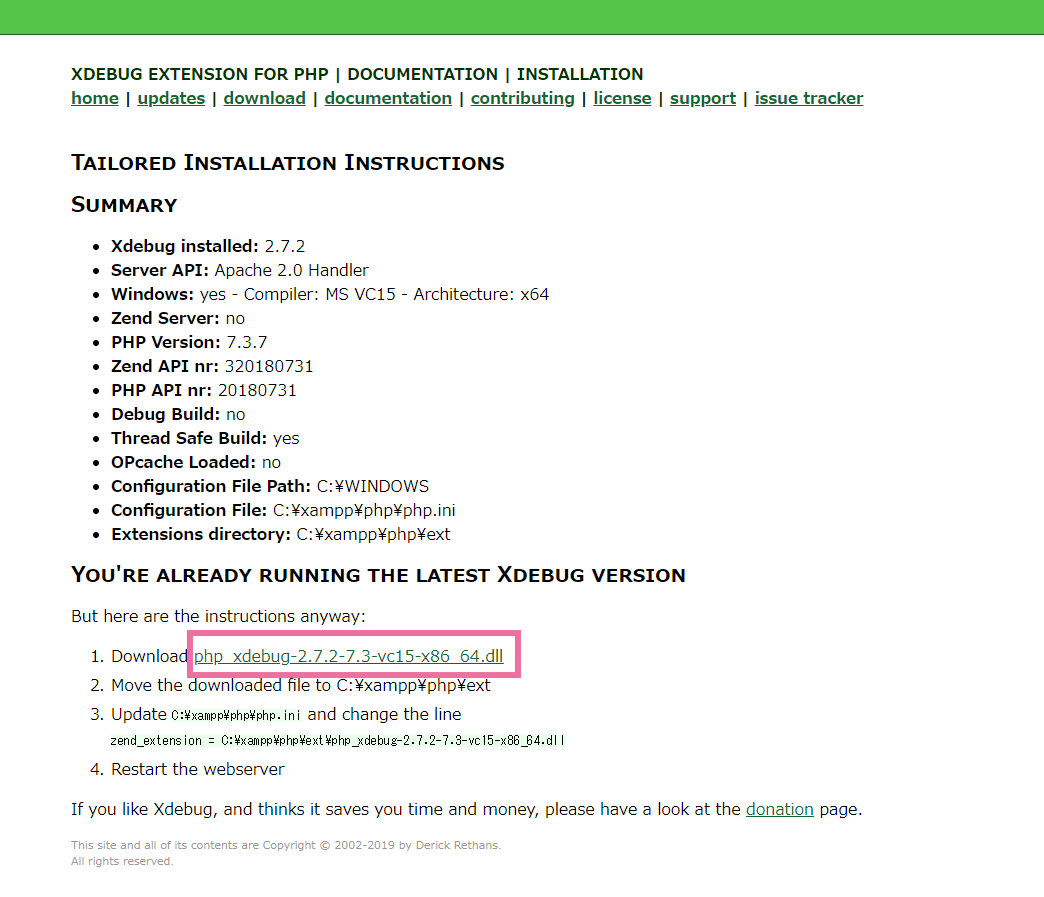
ダウンロードしたDLLファイルは下記ディレクトリ配下へ移動。
C:\xampp\php\ext
4.「XDebug」をVSCodeに紐づけ
C:\xampp\php\php.iniに以下のコードを追記します。
※ zend_extensionの値は3.でダウンロードしたDLLファイル名
...
[XDebug]
xdebug.remote_enable = 1
xdebug.remote_autostart = 1
xdebug.remote_connect_back = 1
xdebug.remote_port = 9000
zend_extension = C:\xampp\php\ext\php_xdebug-2.7.2-7.3-vc15-x86_64.dll
5. デバッグを行う
ファイル>フォルダーを開く>デバッグしたいファイルのある階層を選択>デバッグするファイルを開く>左メニューバーからデバッグボタンをクリック
「デバッグ開始」ボタン横のプルダウンから「PHP」を選択。
再度プルダウンより「構成の追加」を選択すると、launch.jsonが開くので下記のように修正。
{
    // IntelliSense を使用して利用可能な属性を学べます。
    // 既存の属性の説明をホバーして表示します。
    // 詳細情報は次を確認してください: https://go.microsoft.com/fwlink/?linkid=830387
    "version": "0.2.0",
    "configurations": [
        {
            "name": "Listen for XDebug",
            "type": "php",
            "request": "launch",
            "port": 9000,
            "pathMappings": {
                "${workspaceRoot}": "${workspaceRoot}"
            }
        },
        {
            "name": "Launch currently open script",
            "type": "php",
            "request": "launch",
            "program": "${file}",
            "cwd": "${fileDirname}",
            "port": 9000,
            "pathMappings": {
                "C:\\xampp\\htdocs\\test": "${workspaceRoot}"
            },
            "runtimeExecutable": "C:\\xampp\\php\\php.exe"
        }
    ]
}
デバッグしたいファイルにブレークポイントを置く。
「Launch currently open script」が選択されていることを確認し、デバック開始ボタンを押下。