はじめに
前回の記事に、感染症の拡散を説明するSIRモデルについて説明しました。その時に、SIRモデルを解く数値積分のPythonプログラムも掲載しました。今回の記事には、そのPythonプログラムをGUI化してみます。
前回の記事:感染病の数学予測モデル (SIRモデル):事例紹介(1) https://qiita.com/kotai2003/items/d74583b588841e6427a2
GUIの説明
自分が作ったプログラムをGUI化する理由は、「他人に使ってもらいたいから」です。将来的には、GUIのPyコードだけではなくて、setup.exeの形で配布したいと思います。
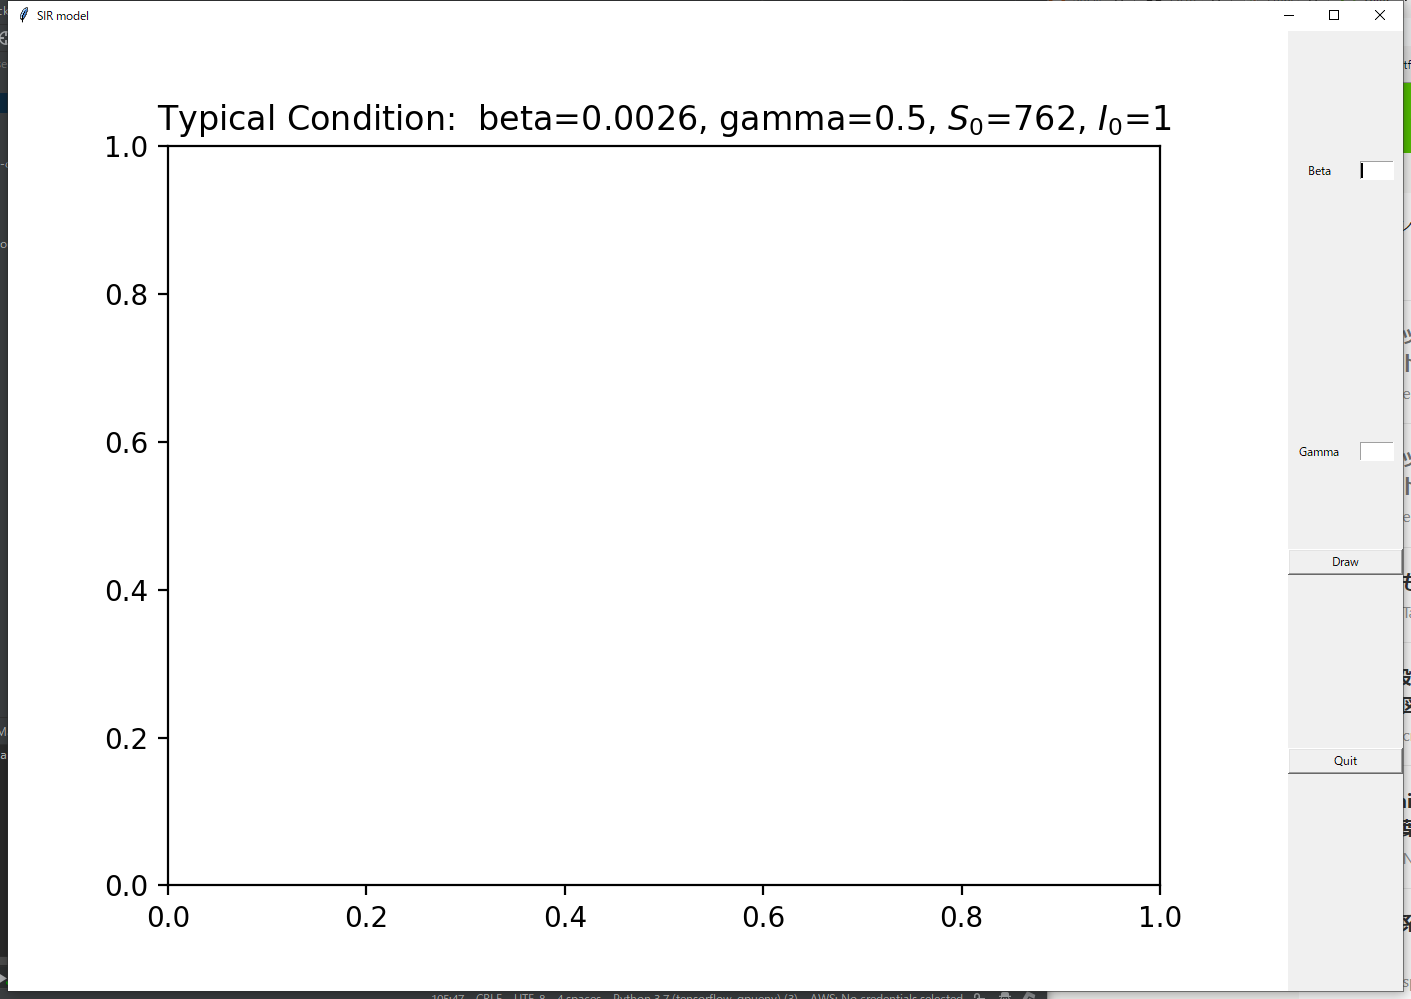
まず、今回に作成したGUIの画面構成です。SIRモデルの感染率(Beta)と除去率(Gamma)を右側の空欄に入力し、その下のDrawボタンを押すと、SIRモデルの計算結果が中央の画面にプロットされます。
\begin{align}

\frac{dS}{dt} &= -\beta SI \\
\frac{dI}{dt} &=  \beta SI -\gamma I \\
\frac{dR}{dt} &=  \gamma I \\

\end{align}
\begin{align}
S &: 感染可能者 \quad \text{(Susceptible)} \\
I &: 感染者 \quad \text{(Infectious)} \\
R &: 感染後死亡者、もしくは免疫を獲得した者 \quad \text{(Removed)} \\
\beta &: 感染率\quad \text{(The infectious rate)} \quad [1/day] \\
\gamma &:除去率\quad \text{(The Recovery rate)} \quad [1/day] \\
\end{align}
初期の画面に、Typical Condition~と書いてありますが、これは感染率(Beta)と除去率(Gamma)を入力する際に参考にするためです。
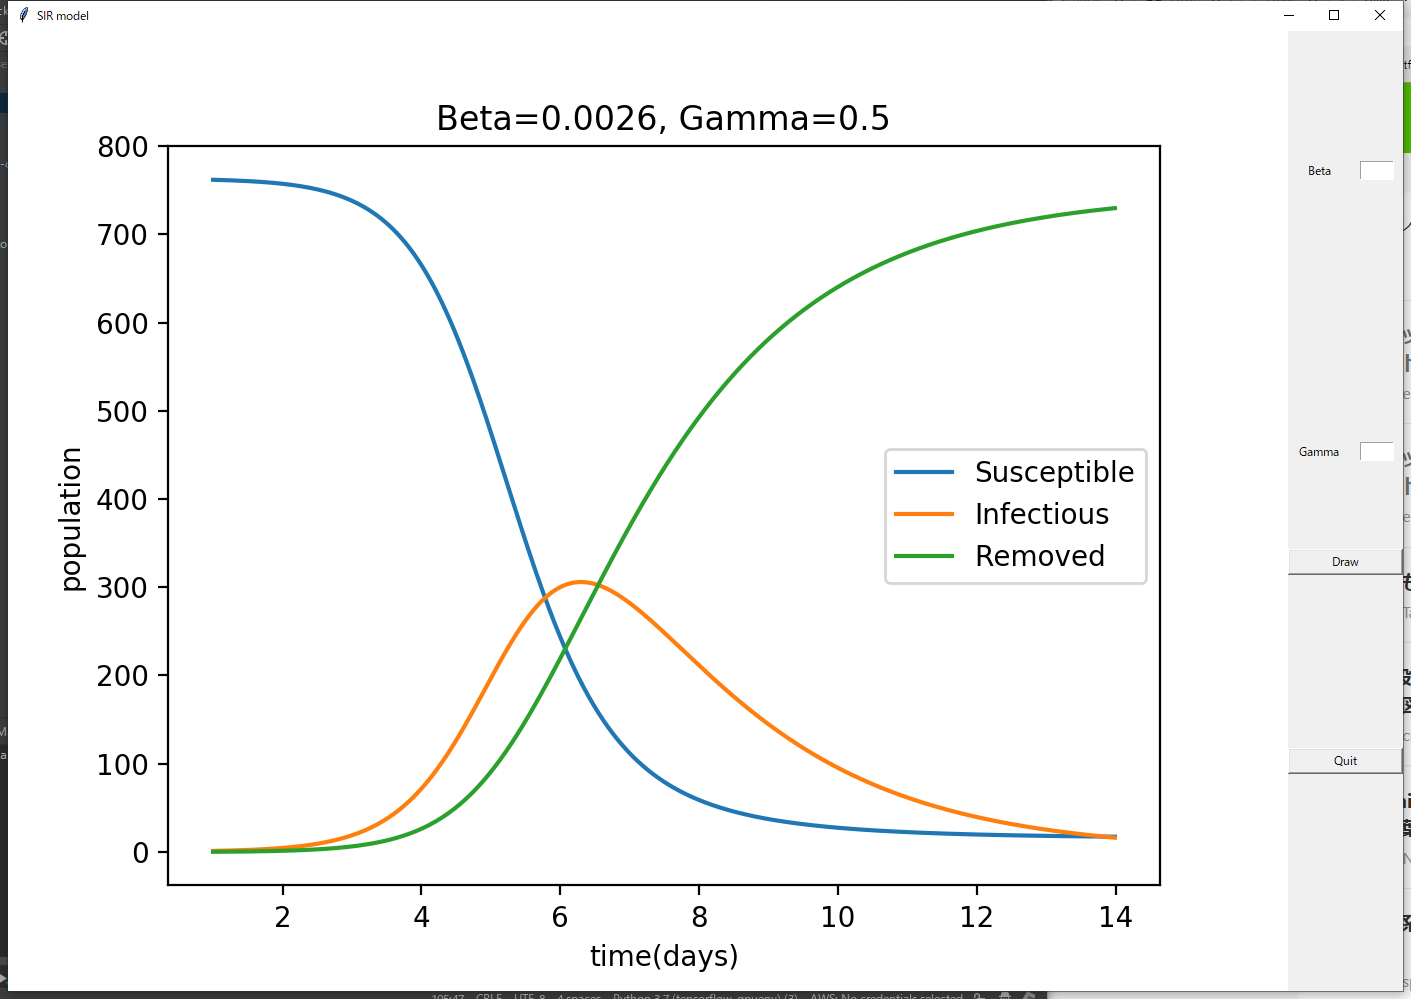
次の画面が計算結果を示します。SIRモデルの数値積分結果がLine Plotで表示されます。新しく入力した感染率(Beta)と除去率(Gamma)の値が、タイトルに更新されます。
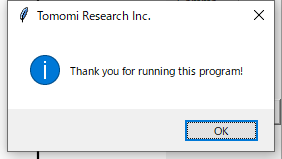
GUIの終了は、右下のQuitボタンを押すことで実行されます。
プログラムの説明
GUIのライブラリは、Tkinterを利用しました。
簡単にプログラムの動作を説明します。
(1) TkinterでCanvas Widgetを用意する。 TkinterのEntry Widgetで、感染率(Beta)と除去率(Gamma)を入力するテキストボックスを用意する。
(2) scipyでSIRモデルを計算し、その結果をmatplotlibでプロットする。
(3) matplotlibのFigureを Canvas WidgetでDrawする。
必要なライブラリをインポートします。
import tkinter
import tkinter.messagebox as tkmsg
import matplotlib.pyplot as plt
from matplotlib.backends.backend_tkagg import FigureCanvasTkAgg
from matplotlib.backends.backend_tkagg import NavigationToolbar2Tk

import numpy as np
from functools import partial
from scipy.integrate import odeint
SIRモデルの数値積分に必要な関数を用意します。
# SIR Differential Equation
def SIR_EQ(v, t, beta, gamma):
    '''
    dS/dt = -beta * S * I
    dI/dt = beta * S * I - gamma * I
    dR/dt = gamma * I

    [v[0], v[1], v[2]]=[S, I, R]

    dv[0]/dt = -beta * v[0] * v[1]
    dv[1]/dt = beta * v[0] * v[1] - gamma * v[1]
    dv[2]/dt = gamma * v[1]

    '''
    return [-beta*v[0]*v[1], beta * v[0] * v[1] - gamma * v[1], gamma * v[1]]

# Solving SIR Equation
def Calc_SIR(var_b, var_r):
    # parameters
    t_max = 14
    dt = 0.01
    #beta_const = 0.0026
    #gamma_const = 0.5

    beta_const = var_b
    gamma_const = var_r

    # initial_state
    S_0 = 762
    I_0 = 1
    R_0 = 0
    ini_state = [S_0, I_0, R_0]  # [S[0], I[0], R[0]]

    # numerical integration
    times = np.arange(1, t_max, dt)
    args = (beta_const, gamma_const)
    # Solver SIR model
    result = odeint(SIR_EQ, ini_state, times, args)
    return times,result
TkinterのボタンのEventの時に実行される関数を用意します。
DrawCanvas関数に、matplotlibのaxesインスタンス(=ax)を用意し、そのインスタンスをプロットする仕組みです。最後のcanvas.draw()で、matplotlibのaxesインスタンスが、canvas widgetに表示されることになります。
def Quit():
    tkmsg.showinfo("Tomomi Research Inc.","Thank you for running this program!")
    root.quit()
    root.destroy()

# Draw Button
def DrawCanvas(canvas, ax):
    value_beta = EditBox_beta.get()
    value_gamma = EditBox_gamma.get()
    if value_beta != '':
        EditBox_beta.delete(0, tkinter.END)
        EditBox_gamma.delete(0, tkinter.END)
        ax.cla()
        beta = float(value_beta)
        gamma = float(value_gamma)
        t_r, res_r = Calc_SIR(beta,gamma)

        ax.plot(t_r, res_r)
        ax.legend(['Susceptible', 'Infectious', 'Removed'])
        ax.set_title('Beta='+str(beta)+', Gamma='+str(gamma) )
        ax.set_xlabel('time(days)')
        ax.set_ylabel('population')
    canvas.draw()
この部分はメインのプログラムです。
Tkinterの各Widgetの設定は、この部分に書いてあります。
if __name__ == '__main__':
    try:
        # GUI generate
        root = tkinter.Tk()
        root.title("SIR model")

        # Graph setting
        fig, ax1 = plt.subplots()
        #fig.gca().set_aspect('equal', adjustable='box')  # グラフ領域の調整 #get current axes

        ax1.set_title('Typical Condition:  beta=0.0026, gamma=0.5, $S_0$=762, $I_0$=1')


        # Generate Canvas
        Canvas = FigureCanvasTkAgg(fig, master=root)
        Canvas.get_tk_widget().grid(row=0, column=0, rowspan=10)

        #Beta
        EditBox_beta = tkinter.Entry(width=5)  # テキストボックスの生成
        EditBox_beta.grid(row=1, column=2)

        GridLabel_beta = tkinter.Label(text="Beta")
        GridLabel_beta.grid(row=1, column=1)

        # Gamma
        EditBox_gamma = tkinter.Entry(width=5)  # テキストボックスの生成
        EditBox_gamma.grid(row=4, column=2)

        GridLabel_gamma = tkinter.Label(text="Gamma")
        GridLabel_gamma.grid(row=4, column=1)

        # ボタンに関する諸々の設定
        ReDrawButton = tkinter.Button(text="Draw", width=15, command=partial(DrawCanvas, Canvas, ax1))  # ボタンの生成
        ReDrawButton.grid(row=5, column=1, columnspan=2)  # 描画位置(テキトー)

        QuitButton = tkinter.Button(text="Quit", width=15, command=Quit)  # ボタンの生成
        QuitButton.grid(row=7, column=1, columnspan=2)  # 描画位置(テキトー)

        DrawCanvas(Canvas, ax1)
        root.mainloop()
    except:
        import traceback

        traceback.print_exc()
    finally:
        input(">>")  # エラー吐き出したときの表示待ち
まとめ
Python GUIのライブラリには、Tkinterと PyQTが有名だそうですが、Tkiknterが初心者にもプログラムしやすいと聞いたため、Tkinterを選んでみました。未だにもPyQTに興味がありますので、両方使ったことがある方は、コメントを残していただければと思います。
PythonのGUIのメリットは、Cross Platformであることだと思います。プログラムを一つ作成すれば、変更なしにWindows, Mac OS, Linuxに使えることが可能です。現在、WindowsでDeep Learningのプログラムを開発し、Nvidia製のJetson系(Linux)に実装することを考えています。その時、Python GUIが大変役に立つと思います。
参考資料
- MatplotlibにGUI(Tkinter)を組み合わせる話 https://www.shtsno24.tokyo/2018/12/matplotlibguitkinter.html
- Matplotlib&Seaborn実装ハンドブック https://amzn.to/2ujQ2CL
- 感染病の数学予測モデルの紹介 (SIRモデル)https://qiita.com/kotai2003/items/3078f4095c3e94e5325c
- 感染病の数学予測モデル (SIRモデル):事例紹介(1) https://qiita.com/kotai2003/items/d74583b588841e6427a2
- Embedding in Tk https://matplotlib.org/gallery/user_interfaces/embedding_in_tk_canvas_sgskip.html


