問題の背景
状況の説明がちょっと難しいんですが。
たとえば階層線形モデルをつくっていて,群ごとに線形モデルを当てはめたとします。
数値的な結果を見て,固定効果はこれぐらいねアハーン,と思うことはできるんですが,やっぱり群ごとに当てはめて見てみたいですよね。
できれば確信区間つきで。
ggplotのgeom_smoothで書いてもいいんですが,自分で推定した値を使いたいということもあると思いますし,線形モデルじゃない独自関数の場合もあるかも。
そんなときの問題です。
具体例
次のコードを実行すると,irisのSpeciesごとの線形回帰ができます。
dat_lm <- iris %>%
  group_by(Species) %>%
  nest() %>%
  mutate(model_lm = map(data, ~lm(Petal.Length ~ Sepal.Width, data = .))) %>%
  mutate(coeff = map(model_lm,tidy)) %>%
  unnest(coeff) %>%
  select(Species,data,term,estimate) %>%
  pivot_wider(id_cols=c(Species,data),names_from=term,values_from=estimate) %>%
  rename(b0=3,b1=4)
仕上がりはこんな感じ。
# A tibble: 3 × 4
# Groups:   Species [3]
  Species    data                 b0     b1
  <fct>      <list>            <dbl>  <dbl>
1 setosa     <tibble [50 × 4]>  1.18 0.0814
2 versicolor <tibble [50 × 4]>  1.93 0.839
3 virginica  <tibble [50 × 4]>  3.51 0.686
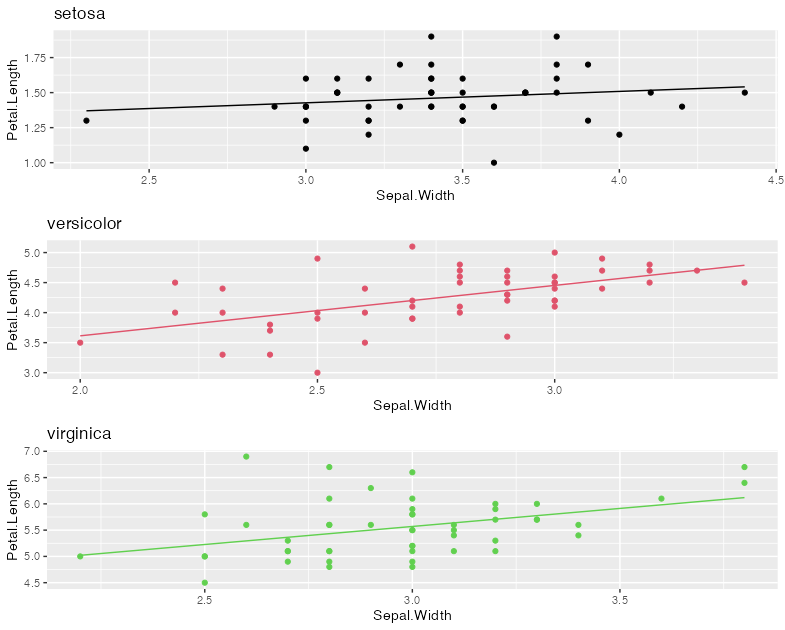
ここから,次のような図が描きたいわけです。
もちろんggplotで。
たとえば次のような,geom_smoothとかfacet_wrapはナシです。
というのも,関数が独自なものでmethodが使えないかもしれないし,今回の推定値を使いたいから。サンプルデータでは切片(b0)と傾き(b1)しかないですが,たとえばこれに95%CIの推定値などがついてて,それを含めて図にしたいとか,色々あるかもしれないから。
ggplot(iris, aes(x = Sepal.Width, y = Petal.Length, group = Species)) +
  geom_point() +
  facet_wrap(~Species) +
  geom_smooth(method = "lm", se = F)
いかがでしょう。
解答編はこちら。
ヒントです。私の解法では,gridExtraパッケージを使いました。
