matplotlibで作成したプロットを新しいウィンドウに表示するのではなく、画像ファイルに保存する方法です。
サーバーでプログラムを動かした時に役に立ちました。
環境
- Ubuntu 14.04.5 LST
- Python 2.7.6
- matplotlib 1.3.1
- numpy 1.8.2
画面に表示しないで画像ファイルとして保存する
(1) pyplotをインポートする前にmatplotlib.use('Agg')を記述します。
(2) plt.savefig(figure.png')で画像ファイルとして保存します。この場合カレントディレクトリに保存されます。
import numpy as np
import matplotlib
matplotlib.use('Agg') # -----(1)
import matplotlib.pyplot as plt

# y = f(x)
x = np.linspace(-np.pi, np.pi)
y1 = np.sin(x)
y2 = np.cos(x)

# figure
fig = plt.figure()
ax = fig.add_subplot(1, 1, 1)

# plot
ax.plot(x, y1, linestyle='--', color='b', label='y = sin(x)')
ax.plot(x, y2, linestyle='-', color='#e46409', label='y = cos(x)')

# x axis
plt.xlim([-np.pi, np.pi])
ax.set_xticks([-np.pi, -np.pi/2, 0, np.pi/2, np.pi])
ax.set_xticklabels(['-pi', '-pi/2', '0', 'pi/2', 'pi'])
ax.set_xlabel('x')

# y axis
plt.ylim([-1.2, 1.2])
ax.set_yticks([-1, -0.5, 0, 0.5, 1])
ax.set_ylabel('y')

# legend and title
ax.legend(loc='best')
ax.set_title('Plot of sine and cosine')

# save as png
plt.savefig('figure.png') # -----(2)
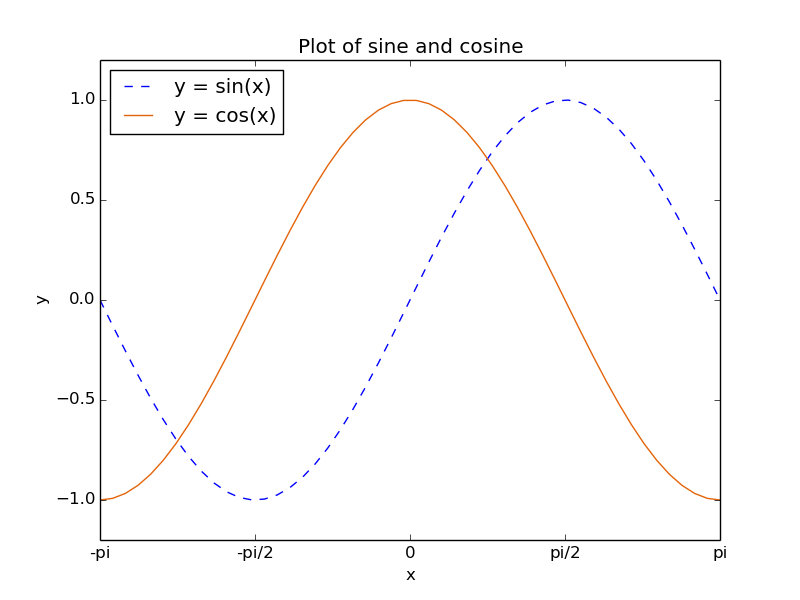
結果
作成された画像ファイルを示します。
参考
公式ページのdocを参考にしました。