前回に引き続き、DECK.GLを使ってGoogleMapのタイムラインをビジュアル化してみよう!の第5弾の記事です。
今回でこのシリーズは最終回です!
前回はDeckGLにマップコンポーネントを組み込んだものをブラウザで確認できました。
とは言ってもまだダミーデータの表示しかできていないので、今回は実際にタイムラインデータを表示したいと思います。
目次
本記事は全5回に渡り説明していきます。
- ReactとDECK.GLの環境構築
- 基本的なReactのコードをブラウザで確認
- DECK.GLを使った簡単なデータの表示
- マップコンポーネントの表示
- GoogleMapタイムラインデータ表示 ←今回はコレ
Google Mapタイムラインデータのダウンロード
まず始めに、GoogleMapからタイムラインデータをダウンロードしましょう!
Google Mapにアクセス
まずGoogle Mapにアクセスします。
左上のメニューアイコンをクリックすると下記のメニューが表示されるので、Your timeline(タイムライン)をクリックしましょう。
※Googleにログインしてから実施してください

そうすると、下記のようなタイムライン画面に遷移します。
右下の歯車アイコン(Map(地図)の左)をクリックし、Download a copy of all your data(すべてのデータのコピーをダウンロード)をクリックします。

ダウンロードデータの選択
そしたらダウンロードするデータを選択する画面に遷移するので、Location History(ロケーション履歴)にチェックを入れて、一番下にある「Next step(次のステップ)」ボタンをクリックします。

次に、アーカイブのファイル形式と、アーカイブをダウンロードするかクラウドに保存するかを選択する画面に遷移するので、好きな方法を選択します。
※ 私は「メールで受け取る」「1回限りのアーカイブ」「zip形式」を選択しました

選択したら「Create archive(アーカイブを作成)」ボタンをクリック!
これでデータダウンロードは完了です。
サイズにもよりますが、私の場合はすぐに(1分もしないくらい)アーカイブ完了のメールが届きました。
データの確認
メールにタイムラインデータが届いたら、早速ダウンロードして中身を見てみましょう!
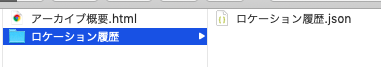
zipファイルを解凍すると、中にはhtmlファイルとjsonファイルが格納されています。
htmlファイルにはデータの説明が、jsonファイルには実際のタイムラインデータが入っています。
jsonファイルの中身はこんな感じ。
{
  "locations" : [ {
    "timestampMs" : "1534792059283",
    "latitudeE7" : 378718885,
    "longitudeE7" : -1222666563,
    "accuracy" : 65,
    "altitude" : 59,
    "verticalAccuracy" : 10
  }, {
   ...
  }]
}
データのフォーマット
データの説明はHTMLに記載がありますが、このようなデータが含まれています。
| key | 説明 |
|---|---|
| locations | All location records. |
| timestampMs(int64) | Timestamp (UTC) in milliseconds for the recorded location. |
| latitudeE7(int32) | The latitude value of the location in E7 format (degrees multiplied by 10**7 and rounded to the nearest integer). |
| longitudeE7(int32) | The longitude value of the location in E7 format (degrees multiplied by 10**7 and rounded to the nearest integer). |
| accuracy(int32) | Approximate location accuracy radius in meters. |
| velocity(int32) | Speed in meters per second. |
| heading(int32) | Degrees east of true north. |
| altitude(int32) | Meters above the WGS84 reference ellipsoid. |
| verticalAccuracy(int32) | Vertical accuracy calculated in meters. |
| activity | Information about the activity at the location. |
| timestampMs(int64) | Timestamp (UTC) in milliseconds for the recorded activity. |
| type | Description of the activity type. |
| confidence(int32) | Confidence associated with the specified activity type. |
Google Mapタイムラインデータの組み込み
それでは早速タイムラインデータを組み込んでいきましょう!!
データの読み込み
srcフォルダの中にdataフォルダを作成し、その中にダウンロードしたjsonファイルをlocations.jsonという名前で格納しましょう。
こんな感じ ![]()

これをtripDataという名前でimportします。
import React from "react";
import DeckGL from "@deck.gl/react";
import { PathLayer } from "@deck.gl/layers";
import MapGL from "react-map-gl";
import "mapbox-gl/dist/mapbox-gl.css";
import tripData from "./data/locations.json";
Viewportの設定修正
今まで設定していたViewportはサンフランシスコ辺りを指定していたので、シアトル中心部辺りの座標に書き換えます。
// Viewport 初期設定
const viewState = {
  latitude: 47.60521,
  longitude: -122.33207,
  zoom: 12.3
};
描画データの削除
前回までは描画データを下記のように定義していましたが、もう必要ないので、こちらの記述は削除します。
// 描画する地理データ
const data = [
  {
    path: [
      [-122.45, 37.7],
      [-122.5, 37.8],
      [-122.6, 37.7]
    ]
  }
];
レンダリング
最後にレンダリング部分を書いていきましょう。
コンストラクタの設定
後ほどタイムラインデータをstateに格納するので、timelinePointsという名前で初期値(空の配列)を設定します。
stateで設定したデータはコンポーネント内で使用でき、値が変更されると変更部分のみを更新します。
constructor(props) {
  super(props);
  this.state = {
    timelinePoints: []
  };
}
タイムラインデータの整形
先ほどダウンロードしたタイムラインの緯度・経度は通常の値に10 * 7 を掛けたものが設定されているので、表示する前に割り戻す必要があります。
formatLocationsという関数を作成し、整形処理を行いましょう。整形後の配列データはstateにセットします。
この関数がコンポーネントのマウントが行われた時に1度だけ実行してほしいので、componentDidMount()の中で呼び出しましょう。
componentDidMount() {
  this.formatLocations();
}

formatLocations = () => {
  if (tripData) {
    const timelinePoints = tripData.locations.reduce((accu, curr) => {
      // lat/longのデータを 10000000 で割る
      accu.push([curr.longitudeE7 / 10000000, curr.latitudeE7 / 10000000]);
      return accu;
    }, []);
    this.setState({ timelinePoints });
  }
};
レンダリング
最後に、PathLayerにデータ整形後のタイムラインデータを渡してあげましょう。
tripsという名前で、pathオブジェクトにstateに格納されている整形後の[緯度,経度]のデータを代入します。
そしたら、PathLayerのインスタンス生成部分のdataにtripsの変数を渡します。
render() {
  const trips = [{
    path: this.state.timelinePoints
  }];
  const layer = [
    new PathLayer({
      id: "path-layer",
      data: trips,
      getPath: d => d.path,
      getWidth: 30
    })
  ];
  ...

}
ブラウザで表示
それでは最後にブラウザで表示してみましょう!
yarn startコマンドで起動させると・・・
![]()
![]()
![]()

無事シアトルの地図の上に、私のGoogleMapのタイムラインが表示されました〜!!![]()
![]()
最後に
DECK.GLにはもっといろいろなレイヤーがあります。
今回はシンプルなものでビジュアライズを行いましたが、今後はもっといろんなレイヤーを使っていろんなデータをビジュアライズさせたいと思っています!!
おまけ 
Trips LayerとIcon Layerを使って、このタイムラインデータを時系列データを使ってアニメーションさせつつ、スターバックスの店舗データを表示させたものを下記のGitHubにあげていますので、ご興味ある方は是非こちらもご覧ください ![]()
https://github.com/nouvelle/starbucks-journey
ここまでご覧いただきありがとうございました!!![]()
App.jsxの全体像
import React from "react";
import DeckGL from "@deck.gl/react";
import { PathLayer } from "@deck.gl/layers";
import MapGL from "react-map-gl";
import "mapbox-gl/dist/mapbox-gl.css";
import tripData from "./data/locations.json";

// mapbox access token
const MAPBOX_ACCESS_TOKEN = "pk.eyJ1IjoiZ.......";

// Viewport 初期設定
const viewState = {
  latitude: 47.60521,
  longitude: -122.33207,
  zoom: 12.3
};

export default class App extends React.Component {
  constructor(props) {
    super(props);
    this.state = {
      timelinePoints: []
    };
  }

  componentDidMount() {
    this.formatLocations();
  }

  formatLocations = () => {
    if (tripData) {
      const timelinePoints = tripData.locations.reduce((accu, curr) => {
        // lat/longのデータを 10000000 で割る
        accu.push([curr.longitudeE7 / 10000000, curr.latitudeE7 / 10000000]);
        return accu;
      }, []);
      this.setState({ timelinePoints });
    }
  };

  render() {
    // 描画する地理データ
    const trips = [{
      path: this.state.timelinePoints
    }];
    const layer = [
      new PathLayer({
        id: "path-layer",
        data: trips,
        getPath: d => d.path,
        getWidth: 30
      })
    ];
    return (
      <DeckGL viewState={viewState} layers={layer}>
        <MapGL mapboxApiAccessToken={MAPBOX_ACCESS_TOKEN} />
      </DeckGL>
    );
  }
}