メモ目的
普段グラフ作成にmatplotlibを使っているますが、ネットワークを可視化するのはやっぱり専用のパッケージがいいので使ってみた機能をメモします。
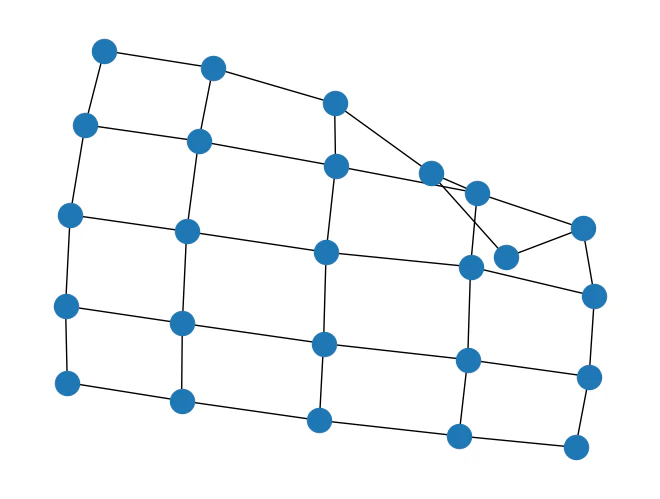
networkXで5×5の格子上ネットワークを作成
以下のコードで表示してみると、5×5のノードを持ち、それぞれがつながったグラフが出力されます。ただ、ノードのposを指定していないため、場所は適当になります。
import networkx as nx

G = nx.grid_2d_graph(5, 5)  # 5x5 grid
nx.draw(G)
ドキュメントよりposは辞書型で、ノードをキーとポジションを値として持つようです。もしなければその都度、spring layout positioning?というものが計算されるそうです。
pos:dictionary, optional
A dictionary with nodes as keys and positions as values. If not specified a spring layout positioning will be computed. See networkx.drawing.layout for functions that compute node positions.
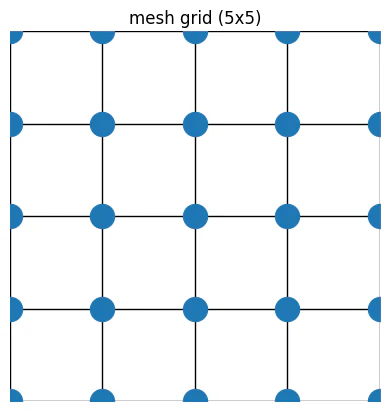
正方形にノードが並ぶようにしたいので、posを決めていきます。
まず具体的にxyともに0-10のグラフに配置するとします。
import networkx as nx
import numpy as np
import matplotlib.pyplot as plt

fig,ax = plt.subplots()
ax.set_aspect("equal")
ax.set_title("mesh grid (5x5)")
ax.set_xlim(0,10)
ax.set_ylim(0,10)

G = nx.grid_2d_graph(5, 5)  # 5x5 grid
x = np.linspace(0, 10, 5)
y = np.linspace(0, 10, 5)
X, Y = np.meshgrid(x, y)]
pos = {}
for idx,node in enumerate(G.nodes()):
  pos[node] = [X.flatten()[idx],Y.flatten()[idx]]
nx.draw(G,pos,ax)