目的
記事(M5Stackに温度センサーDS18B20を繋げて気温(℃ および F)を取得する)の続きで取得した温度データを Ambient というIoTデータ可視化サービスに投げて、WEB公開してみました。その備忘録としてこちらに投稿しておきます。
準備
-
Ambient へユーザー登録し下記2点取得します。
- チャネルID
- ライトキー
- M5Stack に対して Windows ではじめるM5Stack などを参考に Hello World のサンプルを動作確認します。
- こちら を参考に Ambient ライブラリのインストールをします。
- 先の記事(M5Stackに温度センサーDS18B20を繋げて気温(℃ および F)を取得する)を実施済みとします。
下記の道具を準備します。
- PC(Windows 10 Pro)
-
M5Stack BASIC
- USB-Cケーブル(M5Stack BASICに含まれる)
- ジャンパワイヤ オスーメス 3本(M5Stack BASICに含まれる)
- DS18B20
- 2.2kΩカーボン抵抗
- ブレッドボード
手順
1. M5Stack へのプログラムの書き込み
M5Stack を USB-C ケーブルで PC と接続し、PC側でArduino IDE を起動し、下記コードをコピペして M5Stack にプログラムの書き込みをします。
# include <WiFi.h>
# include <M5Stack.h>
# include <OneWire.h>
# include <DallasTemperature.h>
# include "Ambient.h"

# define ONE_WIRE_BUS 2 // DS18B20 on arduino pin2 corresponds to D4 on physical board
# define PERIOD 60

OneWire oneWire(ONE_WIRE_BUS);
DallasTemperature DS18B20(&oneWire);

Ambient ambient; // Define Ambient Object
unsigned int channelId = 10536; // Channel ID of Ambient
const char* writeKey = "0badcad8f0f1af5c"; // Write Key of Ambient

WiFiClient client;
const char* ssid = "********";
const char* password = "********";

void setup() {
  M5.begin();
  M5.Lcd.setTextColor(TFT_WHITE, TFT_BLACK);
  M5.Lcd.setTextSize(2);

  WiFi.begin(ssid, password);
  while (WiFi.status() != WL_CONNECTED) {
    delay(100);
    M5.Lcd.print(".");
  }
  M5.Lcd.print("\n");
  M5.Lcd.print(WiFi.localIP());

  ambient.begin(channelId, writeKey, &client);
}

void loop() {
  int t = millis();
  float celsius;
  float fahrenheit;

  DS18B20.begin();
  int count = DS18B20.getDS18Count();

  //M5.Lcd.clear();
  M5.Lcd.setCursor(0, 0);
  M5.Lcd.print("Devices found: ");
  M5.Lcd.println(count);

  if (count > 0) {

    DS18B20.requestTemperatures();

    celsius = DS18B20.getTempCByIndex(0);
    fahrenheit = celsius * 1.8 + 32.0;

    ambient.set(1, String(celsius).c_str());
    ambient.send();

    celsius = round(celsius);
    fahrenheit = round(fahrenheit);

    M5.Lcd.print("Device ");
    M5.Lcd.print(0);
    M5.Lcd.print(": ");
    M5.Lcd.print(celsius, 0);
    M5.Lcd.print( "C / ");
    M5.Lcd.print(fahrenheit, 0);
    M5.Lcd.println("F");
  }

  t = millis() - t;
  t = (t < PERIOD * 1000) ? (PERIOD * 1000 - t) : 1;
  delay(t);
}
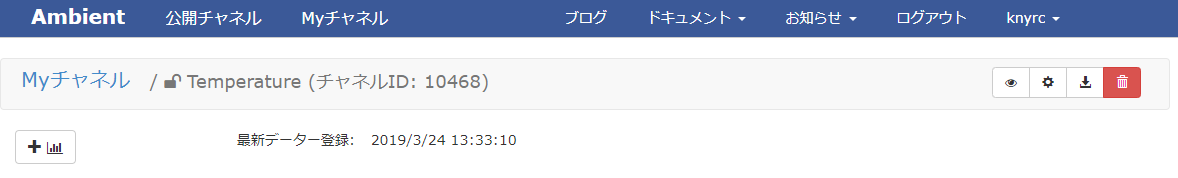
2. Ambient でマイページの確認
Ambient にログインして、作成したチャネルにチャートを追加(下記画面の[+]ボタンを押します)します。
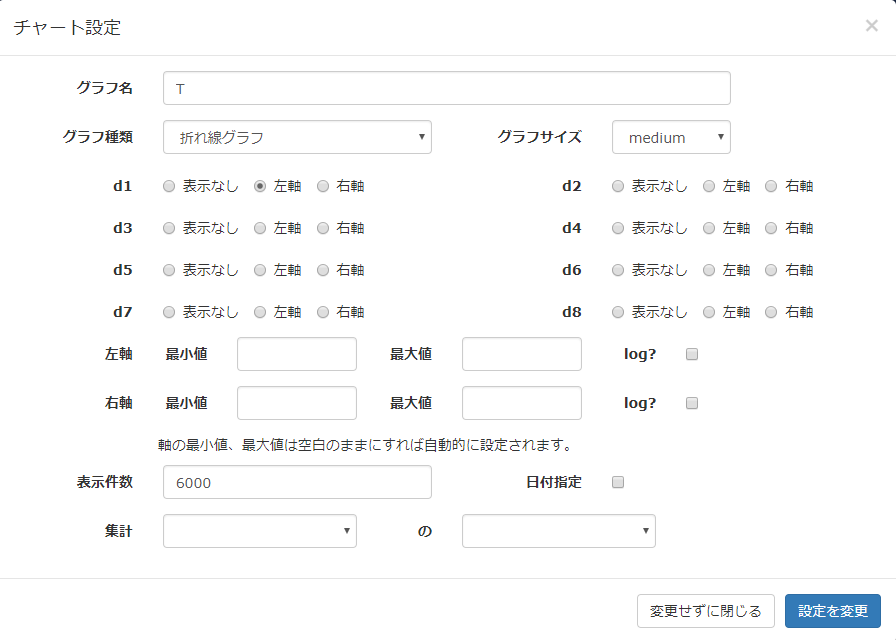
下記のようにチャート設定をします。今回 data1 に温度データを投げているのでそちらを表示するグラフの設定です。
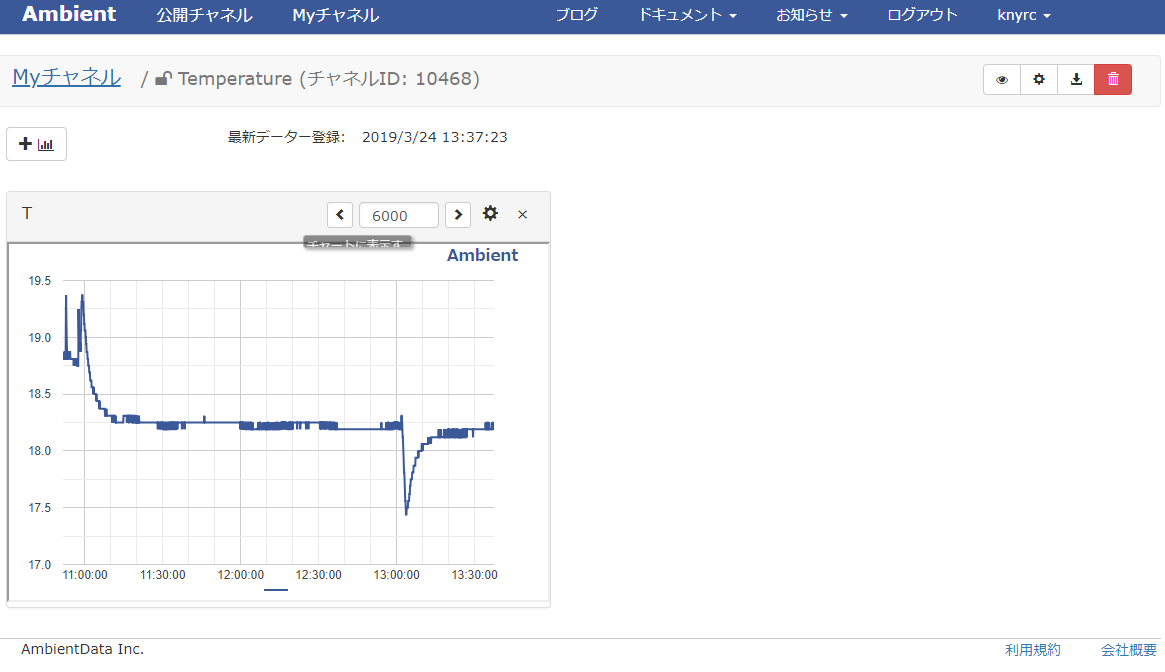
正しくデータが投げられていれば、Myチャネルから下記のように時系列グラフが確認できます。
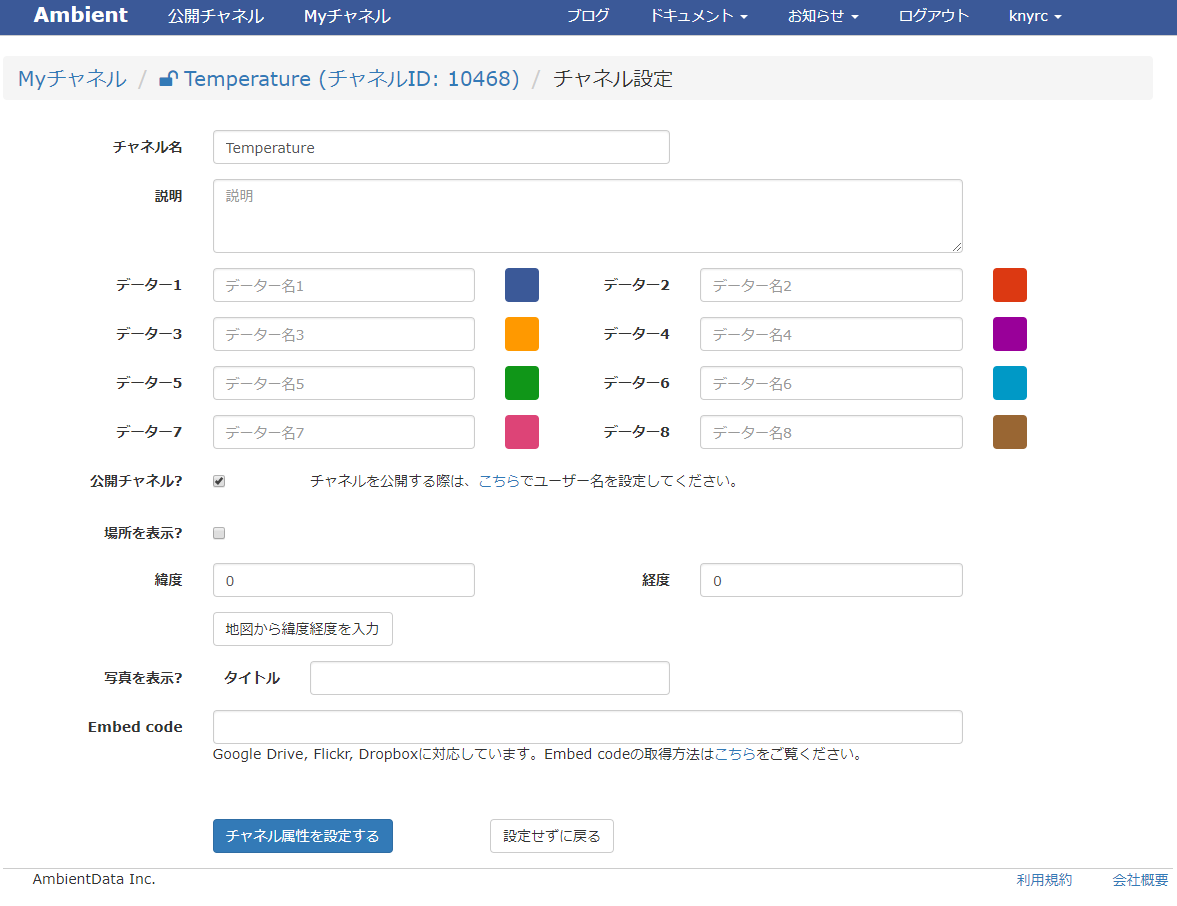
チャネル設定画面にて 公開チャネル? というチェックボックスを☑します。
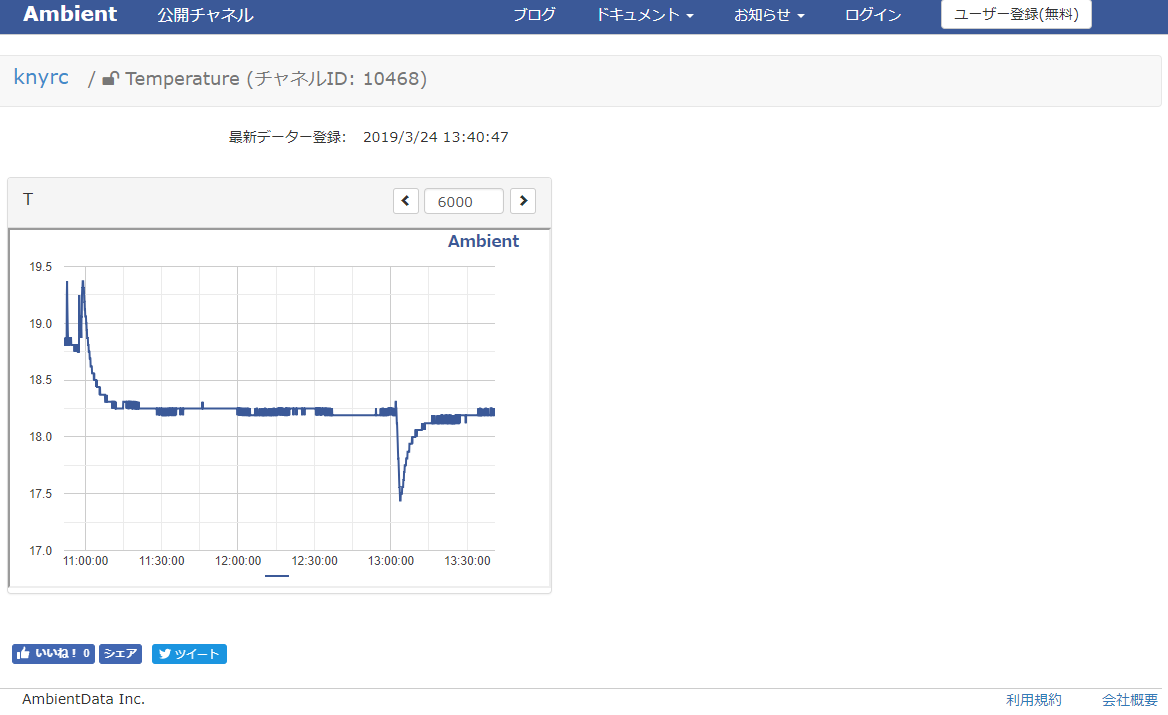
公開された WEB ページは下記です(下記イメージ)
https://ambidata.io/ch/channel.html?id=10536