はじめに
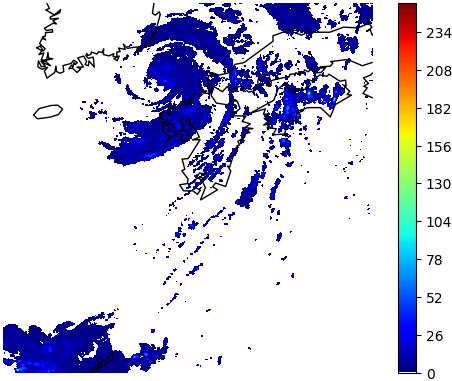
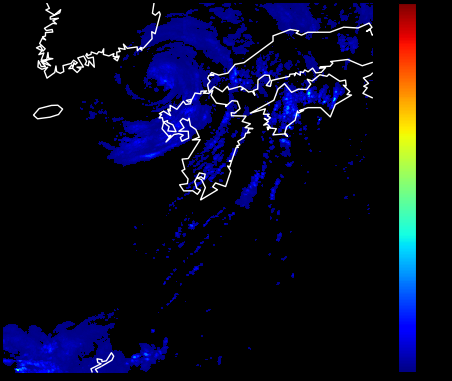
本記事では,気象庁が提供する1km メッシュ全国合成レーダーエコー強度 GPV を用いて下図のようなレーダーエコー強度画像を作成する手順を示します.
全コードは**github**にあります.
| detail | image(2018/07/03 11:00:00) |
|---|---|
| 背景: 白 カラーバー: 有 カラーマップ: jet 海岸線: 有 海岸線の質: low |
 |
| 背景: 黒 カラーバー: 有 カラーマップ: jet 海岸線: 有 海岸線の質: low |
 |
本記事で紹介する全体的な処理手順を示します.
1. 1km メッシュ全国合成レーダーエコー強度 GPVを取得する.(前回記事)
2. 1km メッシュ全国合成レーダーエコー強度 GPVをwgrib2を使って読み取り,Basemapを使って描画する.(本記事)
2番目の処理について本記事で解説したいと思います.
注:私は情報系の学生です.気象分野に精通しているわけではないことをご了承ください.
扱うデータについて
下記資料を参考にしてください.
レーダーエコー強度画像
気象庁 | 気象レーダー
http://www.jma.go.jp/jma/kishou/know/radar/kaisetsu.html
デジタル台風:最新気象レーダー画像 - レーダーエコー強度、レーダーエコー頂高度
http://agora.ex.nii.ac.jp/digital-typhoon/radar/graphics/
1km メッシュ全国合成レーダーエコー強度 GPV
1kmメッシュ全国合成レーダーGPV
http://www.jmbsc.or.jp/jp/online/file/f-online30100.html
配信資料に関する技術情報(気象編)第 162 号
https://www.data.jma.go.jp/add/suishin/catalogue/format/ObdObs001_format.pdf
全体的な流れ
- 取得した.binファイル(GRIB2形式)をwgrib2で分解し,緯度経度データポイントを.binファイルに格納する.
- データ代表値をレベル値に変換する.
- 中心座標を決め,作成する画像の範囲を決める.
- Basemapによる画像化
環境
ubuntu 18.04.1 LTS (on VMware Workstation 15 Player (on windows10 x64))
Anaconda3-5.3.1
wgrib2
wgrib2はGRIB2形式ファイルを読み込むことができるソフトウェアです.
使用法については下記サイトで詳しく解説されているので,確認してみてください.
■ How to use wgrib2 command (hysk)
http://www.hysk.sakura.ne.jp/Linux_tips/how2use_wgrib2
より詳しくは下記公式リファレンスを参照してください.
■ Climate Prediction Center - wgrib2: grib2 utility
https://www.cpc.ncep.noaa.gov/products/wesley/wgrib2/
wgrib2インストール
ここで,wgrib2のインストールについてまとめておきます.
FORTRANをインストールし,環境変数に指定,wgrib2をインストールしパスを通します.
下記操作を順に行えば,特に問題はないと思います.
$ cd ~
$ sudo apt-get install gfortran
$ export FC=gfortran
$ export CC=gcc
$ wget ftp://ftp.cpc.ncep.noaa.gov/wd51we/wgrib2/wgrib2.tgz
$ tar -xvzf wgrib2.tgz
$ cd grib2/
$ make
$ sudo cp ~/grib2/wgrib2/wgrib2 /usr/local/bin/
wgrib2 tips
使い方
$ wgrib2 data
# 1:0:d=2017010120:var discipline=0 center=34 local_table=1 parmcat=1 parm=201:surface:-10-0 min acc fcst:
デフォルトでNS→SN(方角)に変換されるので,指定してNSのままにする.
$ wgrib2 data -order we:ns
ファイル出力が可能
中身はデータ値が格子に沿って羅列されたもの(ここではNW→SEへ)
$ wgrib2 data -order we:ns -no_header -bin new_data
ファイル出力形式は下記が可能
- -text
- -bin
- -ieee
Basemap
Basemapはpythonで地図をプロットすることができるライブラリです.
緯度経度のグリッドデータから図を作成できます.
BasemapはPROJ_LIBに関するimportエラーが多発するので,ここに暫定的なimport方法をまとめます.
$ conda install basemap
import Basemap前に下記コードを挿入
# Hack to fix missing PROJ4 env var
import os
import conda

conda_file_dir = conda.__file__
conda_dir = conda_file_dir.split('lib')[0]
proj_lib = os.path.join(os.path.join(conda_dir, 'share'), 'proj')
os.environ["PROJ_LIB"] = proj_lib
from mpl_toolkits.basemap import Basemap
■ KeyError 'PROJ_LIB' · Issue #30 · conda-forge/basemap-feedstock
https://github.com/conda-forge/basemap-feedstock/issues/30#issuecomment-423512069
コード全体
configparserを用いて,設定する必要がある箇所はconfig.iniから読み込んでいます.
最新コードはgithubでご確認ください.
**Ggis1km_image_generator.py**
import matplotlib
matplotlib.use('Agg')
import matplotlib.pyplot as plt
from matplotlib.colors import ListedColormap
import numpy as np
import os
from pathlib import Path
import re
import subprocess
import configparser

# Hack to fix missing PROJ4 env var
import conda
conda_file_dir = conda.__file__
conda_dir = conda_file_dir.split('lib')[0]
proj_lib = os.path.join(os.path.join(conda_dir, 'share'), 'proj')
os.environ["PROJ_LIB"] = proj_lib
from mpl_toolkits.basemap import Basemap, cm

# 設定読み込み
inifile = configparser.ConfigParser()
inifile.read('./config.ini', 'UTF-8')


def convert_rep_to_level(intensity):
    '''
    https://www.data.jma.go.jp/add/suishin/catalogue/format/ObdObs001_format.pdf
    ※3 1kmメッシュ気象庁レーダー全国合成のレベル値(0~251)に沿って変換する
    '''
    intensity_level = np.zeros_like(intensity)
    intensity_level[intensity==9.999e+20] = 0  # レーダー外の値
    intensity_level[intensity==0.1] = 0
    intensity_level[intensity==260] = 255

    # 変換のための各パラメータ
    step_list = [0.1, 0.25, 0.5, 1.0, 2]
    block_first = [0.25, 2.13, 5.25, 10.5, 181]
    data_num = [18, 12, 10, 170, 38]

    for i, step in enumerate(step_list):
        rep = block_first[i] - step
        for i in list(range(data_num[i])):
            rep = round(rep + step, 2)
            mmh = round((rep*2-step)/2, 2)
            intensity_level[intensity==rep] = mmh

    return intensity_level

def crop_latlon(intensity, city, d):
    # 緯度経度の設定
    grid_shape = (3360,2560)
    lat_step = (48-20) / grid_shape[0]
    lon_step = (150-118) / grid_shape[1]

    lats = np.zeros((grid_shape[0],1))
    lons = np.zeros((1,grid_shape[1]))

    for i in list(range(grid_shape[0])):
        lats[i][0] = 48 - i*lat_step
    for i in list(range(grid_shape[1])):
        lons[0][i] = 118 + i*lon_step

    lats = np.tile(lats, (1,grid_shape[1]))
    lons = np.tile(lons, (grid_shape[0],1))

    # 座標を指定,その周辺を切り取る
    n = np.where(lats[:,0] < city[0]+d)[0][0]
    s = np.where(city[0]-d < lats[:,0])[0][-1]
    e = np.where(city[1]-d < lons[0,:])[0][0]
    w = np.where(lons[0,:] < city[1]+d)[0][-1]

    intensity_city = intensity[n:s,e:w]
    lats_city = lats[n:s,e:w]
    lons_city = lons[n:s,e:w]

    return intensity_city, lats_city, lons_city

def draw_map(intensity, city, save_file_path=None):
    # 切り出し
    intensity_city, lats_city, lons_city = crop_latlon(intensity, city, inifile.getint('area', 'd'))

    flat_lats_city = np.ravel(lats_city)
    flat_lons_city = np.ravel(lons_city)

    # 色指定
    # black指定 -> 海岸線白,背景黒  white指定 -> 海岸線黒,背景白
    base_color = inifile.get('image', 'base_color')
    coastline_color = 'white' if base_color == 'black' else 'black'
    zero_color = 0 if base_color == 'black' else 1

    # 色の変更
    cm = eval('plt.cm.' + inifile.get('image', 'color_map'))
    cm_list = cm(np.arange(cm.N))
    cm_list[0,:3] = zero_color    # カラースケール0番目の値の色を変更
    mycmap = ListedColormap(cm_list)

    # 描画矩形座標を指定
    m = Basemap(llcrnrlat=lats_city.min(), urcrnrlat=lats_city.max(), \
                llcrnrlon=lons_city.min(), urcrnrlon=lons_city.max(), \
                resolution=inifile.get('image', 'coastline_quality'))

    # 海岸線
    if inifile.getboolean('image', 'draw_coastline'):
        m.drawcoastlines(color=coastline_color)

    # 描画
    m.contourf(x=flat_lons_city, y=flat_lats_city, data=intensity_city, \
               levels=list(range(0,255)), latlon=True, tri=True, cmap=mycmap)

    # 枠を消す
    plt.gca().spines['right'].set_visible(False)
    plt.gca().spines['top'].set_visible(False)
    plt.gca().spines['left'].set_visible(False)
    plt.gca().spines['bottom'].set_visible(False)

    # カラーバー
    if inifile.getboolean('image', 'draw_colorbar'):
        plt.colorbar()

    # save
    plt.savefig(save_file_path, transparent=True, \
                bbox_inches = 'tight', pad_inches = 0, facecolor=base_color)  # 余白を消す

    plt.clf()

def bin2img(filepath, save_path=None):
    timestamp = re.findall(r'\d{14}', filepath)[0]
    if save_path is not None:
        os.makedirs(save_path, exist_ok=True)
        save_file_path = save_path + '/' + timestamp + '.png'
        if os.path.exists(save_file_path):  # 既に保存したいファイルがあるときスキップ
            return

    # wgrib2で.binファイル(GRIB2ファイル)を読み、形式を変えtemp.binファイルに保存
    subprocess.run(['wgrib2', filepath, '-order', 'we:ns', '-no_header', '-bin', './wgrib2_temp.bin'])

    # 読み込み
    f = open('./wgrib2_temp.bin', mode='rb')
    intensity = np.fromfile(f, dtype='float32',sep='').reshape(3360,2560)  # 格子形状に変形し読み込む
    intensity_level = convert_rep_to_level(intensity)  # データ代表値をレベル値に変換

    city = (inifile.getfloat('center_location', 'latitude'), \
            inifile.getfloat('center_location', 'longitude'))  # 座標を指定

    draw_map(intensity_level, city, save_file_path=save_file_path)


if __name__ == '__main__':
    bin_path = Path(inifile.get('generate_path', 'bin_path'))
    save_path = inifile.get('generate_path', 'img_path')

    for filepath in sorted(bin_path.glob('**/*.bin')):
        bin2img(str(filepath), save_path)
**config.ini**
[generate_path]
# format
#    bin_path ... location of bin file (default: same as download_path.bin_path)
#    img_path ... save location for generated image
bin_path = ../weather/data/kagoshima/bin_test
img_path = ../weather/data/kagoshima/bin_test/img_kagoshima


[center_location]
# format
#    latitude  ... latitude of image's center location
#    longitude ... longitude of image's center location
latitude  = 31.33
longitude = 130.34

[area]
# format
#    d ... distance from image center(lat,lon) to edge
d = 2

[image]
# format
#    base_color: {'black', 'white'} ... image's backgroudcolor
#    color_map: e.g.{'jet', 'gray'}(Colormaps in Matplotlib) ... image's cloud color
#    draw_coastline: bool ... whether to draw coastline
#    coastline_quality: {c(crude), l(low), i(intermediate), h(high), f(full)}
#                      ... coastline quality(only when draw_coastline is True)
#    draw_colorbar: bool ... whether to draw colorbar
base_color = white
color_map = jet
draw_coastline = True
coastline_quality = l
draw_colorbar = True
コンフィグ説明
config.iniに簡単な説明は記述していますが,ここでより詳細な説明をします.
config.ini内の記述を変更するのみで,ソースコードを実行できると思います.
[generate_path]
# format
#    bin_path ... location of bin file (default: same as download_path.bin_path)
#    img_path ... save location for generated image
bin_path = ../weather/data/kagoshima/bin_test
img_path = ../weather/data/kagoshima/bin_test/img_kagoshima
- generate_path -> ファイルパスに関するセクション
- bin_path -> .binファイルが保存されているディレクトリ(基本的にはdownload_pathセクションのbin_pathと同じです)
- img_path -> 作成した画像ファイルの保存先
[center_location]
# format
#    latitude  ... latitude of image's center location
#    longitude ... longitude of image's center location
latitude  = 31.33
longitude = 130.34
- center_location -> 画像の中心座標に関するセクション
- latitude -> 中心の緯度
- longitude -> 中心の経度
[area]
# format
#    d ... distance from image center(lat,lon) to edge
d = 2
- area-> 画像がカバーする範囲に関するセクション
- d-> 中心から東西南北に±dを画像の範囲とする
[image]
# format
#    base_color: {'black', 'white'} ... image's backgroudcolor
#    color_map: e.g.{'jet', 'gray'}(Colormaps in Matplotlib) ... image's cloud color
#    draw_coastline: bool ... whether to draw coastline
#    coastline_quality: {c(crude), l(low), i(intermediate), h(high), f(full)}
#                      ... coastline quality(only when draw_coastline is True)
#    draw_colorbar: bool ... whether to draw colorbar
base_color = white
color_map = jet
draw_coastline = True
coastline_quality = l
draw_colorbar = True
- image-> 画像の見た目に関するセクション
- base_color-> 画像全体の背景の色(下記が使えます)
- black
- white
- color_map-> 降水強度を描画するカラーマップ(下記で動作確認しました)matplotlib.cmに準拠します
- jet
- gray
- draw_coastline-> 海岸線を描画するかどうか
- coastline_quality-> 海岸線の描画精度(draw_coastline = Trueのときのみ動作)(下記が使えます)
- c
- l
- i
- h
- f
- draw_colorbar-> カラーバーを描画するかどうか
- base_color-> 画像全体の背景の色(下記が使えます)
コード解説
コード中の処理を簡単に説明します.
def bin2img(filepath, save_path=None):
    ~~~~~(略)~~~~~
    # wgrib2で.binファイル(GRIB2ファイル)を読み、形式を変えwgrib2_temp.binファイルに保存
    subprocess.run(['wgrib2', filepath, '-order', 'we:ns', '-no_header', '-bin', './wgrib2_temp.bin'])

    # 読み込み
    f = open('./wgrib2_temp.bin', mode='rb')
    intensity = np.fromfile(f, dtype='float32',sep='').reshape(3360,2560)  # 格子形状に変形し読み込む
    intensity_level = convert_rep_to_level(intensity)  # データ代表値をレベル値に変換

    city = ~~~~~(略)~~~~~  # 座標を指定

    draw_map(intensity_level, city, save_file_path=save_file_path)  # 指定範囲を描画
上記bin2img()では,.binファイルの形式をwgrib2で変更し,intensityに読み込みます.
次に,convert_rep_to_level()でデータ代表値をレベル値に変換します.
中心座標を設定し,変換したレベル値をdraw_map()で画像化します.
def convert_rep_to_level(intensity):
    '''
    https://www.data.jma.go.jp/add/suishin/catalogue/format/ObdObs001_format.pdf
    ※3 1kmメッシュ気象庁レーダー全国合成のレベル値(0~251)に沿って変換する
    '''
    ~~~~~(略)~~~~~
    return intensity_level
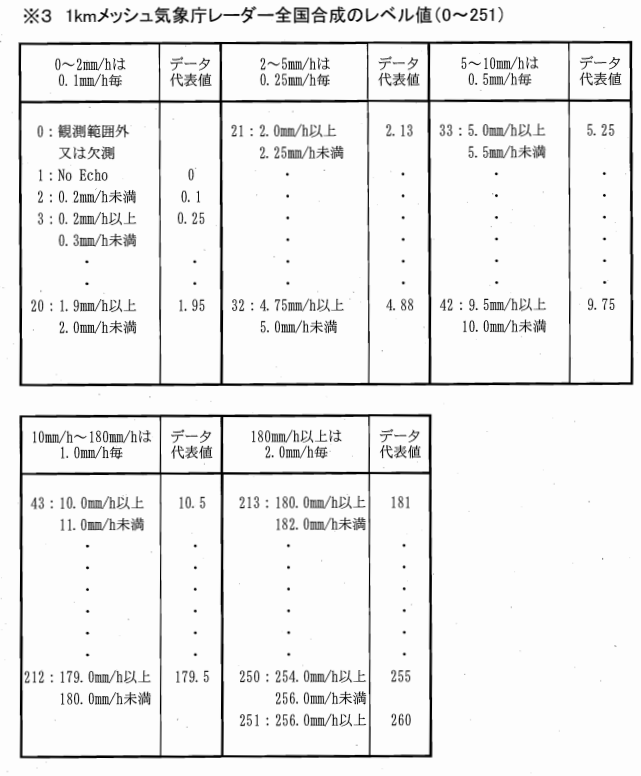
公式のファイルフォーマット P9を見ると,データ代表値の間隔がまばらで扱いづらいです.上記convert_rep_to_level()関数では下表に沿ってデータ代表値をレベル値に変換します.

def draw_map(intensity, city, save_file_path=None):
    # 切り出し
    intensity_city, lats_city, lons_city = crop_latlon(intensity, city, inifile.getint('area', 'd'))

    ~~~~~(略)~~~~~

    # 描画矩形座標を指定
    m = Basemap(llcrnrlat=lats_city.min(), urcrnrlat=lats_city.max(), \
                llcrnrlon=lons_city.min(), urcrnrlon=lons_city.max(), \
                resolution=inifile.get('image', 'coastline_quality'))

    ~~~~~(略)~~~~~

    # 描画
    m.contourf(x=flat_lons_city, y=flat_lats_city, data=intensity_city, \
               levels=list(range(0,255)), latlon=True, tri=True, cmap=mycmap)

    ~~~~~(略)~~~~~

    # save
    plt.savefig(save_file_path, transparent=True, \
                bbox_inches = 'tight', pad_inches = 0, facecolor=base_color)  # 余白を消す
上記draw_map()関数では,指定した座標cityから東西南北にdの範囲の画像を作成します.
まとめ
本記事では,京都大学生存圏研究所より取得した1kmメッシュ全国合成レーダーエコー強度GPVデータから,レーダーエコー強度画像を作成する方法を解説しました.
本記事の内容は,仮想環境のubuntuで実行しました.
その結果,1枚を作成するのに時間がかかったため,windowsで動作するように書き換えました.
windows用のコードを次記事で紹介したいと思います.
最新コードはgithubでご確認ください.
参考
今更ですが、気象データを解析してみた - Qiita
https://qiita.com/ysomei/items/12d6622bed030f6ac793
Pythonでbig endianのbinaryを読み込んでndarrayに変換する - Qiita
https://qiita.com/mhangyo/items/76db7c6a6ebba6cf4330
grib2をpython(matplotlib)で地図上で可視化 - Qiita
https://qiita.com/mhangyo/items/f06debce3975a269a658
How to use wgrib2 command (hysk)
http://www.hysk.sakura.ne.jp/Linux_tips/how2use_wgrib2
wgrib2
http://hydro.iis.u-tokyo.ac.jp/~akira/page/linux/content/wgrib2.html
PHPでライブラリを使わず独力でGRIB2(気象バイナリデータ)を読む - Qiita
https://qiita.com/miyawa-tarou/items/e4eff81dfcac527572e5
How to decode GRIB2 format
http://www.eqh.dpri.kyoto-u.ac.jp/~masumi/sac/grib2.htm
Climate Prediction Center - wgrib2:
https://www.cpc.ncep.noaa.gov/products/wesley/wgrib2/long_cmd_list.html