SAMPLE
REFERENCE
folium 事始め
Folium: Pythonでデータを地図上に可視化
DATA
国土交通省国土政策局のページから町丁目レベル位置参照情報とをダウンロードする。
=>ここではテーブル名[locate_lt_lg]としてSQL Serverに格納。
PYTHON
ここでは
・千代田区
・大字・字・丁目区分コード3
のデータのみを利用する。
import pypyodbc

connection_string ='Driver={SQL Server Native Client 11.0};Server=ServerName;Database=DatabaseName;Uid=UserName;Pwd=Password;'
connection = pypyodbc.connect(connection_string)
SQL = """
  SELECT todofuken_name,shichoson_name,choson_name,lt,lg
  FROM [locate_lt_lg]
  WHERE chomoku_code = '3'
     AND shichoson_name = '千代田区'
"""

cur = connection.cursor()
cur.execute(SQL)

rows = cur.fetchall()
ltlg_data = []
for row in rows:
    ltlg_data.append(row)

cur.close()
connection.close()
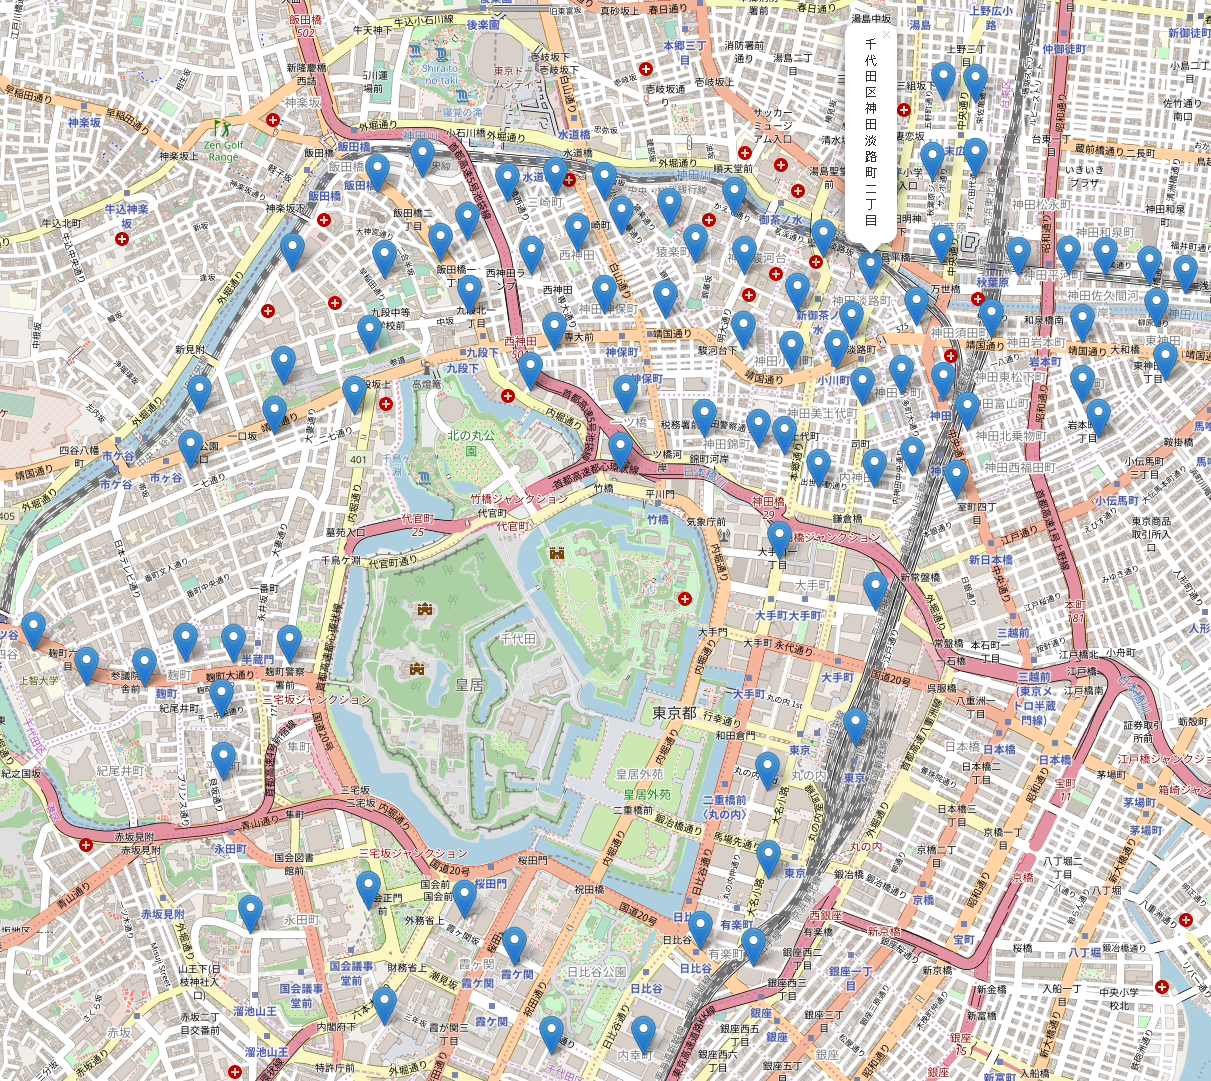
中心座標を東京駅に設定して丁目ごとの代表座標をマーカーとして設置。htmlとして保存する。
import folium
copyright_map = '© <a href="http://osm.org/copyright">OpenStreetMap</a> contributors'
map0 = folium.Map(location=[35.681167, 139.767052],
attr=copyright_map,
zoom_start=15)
states = []
for row in ltlg_data:
state = {}
state['todofuken_name'] = row[0]
state['shichoson_name'] = row[1]
state['choson_name'] = row[2]
state['lt'] = row[3]
state['lg'] = row[4]
states.append(state)
for state in states:
folium.Marker(
[state['lt'], state['lg']],
popup=state['shichoson_name']+state['choson_name'],
).add_to(map0)
map0.save('sample0.html')