--2015/1026更新--
みんな大好き$ggplot2$ ![]()
みんな大好き$iris$ ![]()
> head(iris)
  Sepal.Length Sepal.Width Petal.Length Petal.Width Species
1          5.1         3.5          1.4         0.2  setosa
2          4.9         3.0          1.4         0.2  setosa
3          4.7         3.2          1.3         0.2  setosa
4          4.6         3.1          1.5         0.2  setosa
5          5.0         3.6          1.4         0.2  setosa
6          5.4         3.9          1.7         0.4  setosa
消えたlegendの謎
例えば、横軸に$Sepal.Length$を取って、縦軸には$Sepal$と$Petal$の2種類の$Width$をプロットしたい。legendも付けたい。
ggplot(iris, aes(x=Sepal.Length))+
  geom_point(aes(y = Petal.Width, color="Petal"))+
  geom_point(aes(y = Sepal.Width, color="Speal"))+
  ylab("Width")
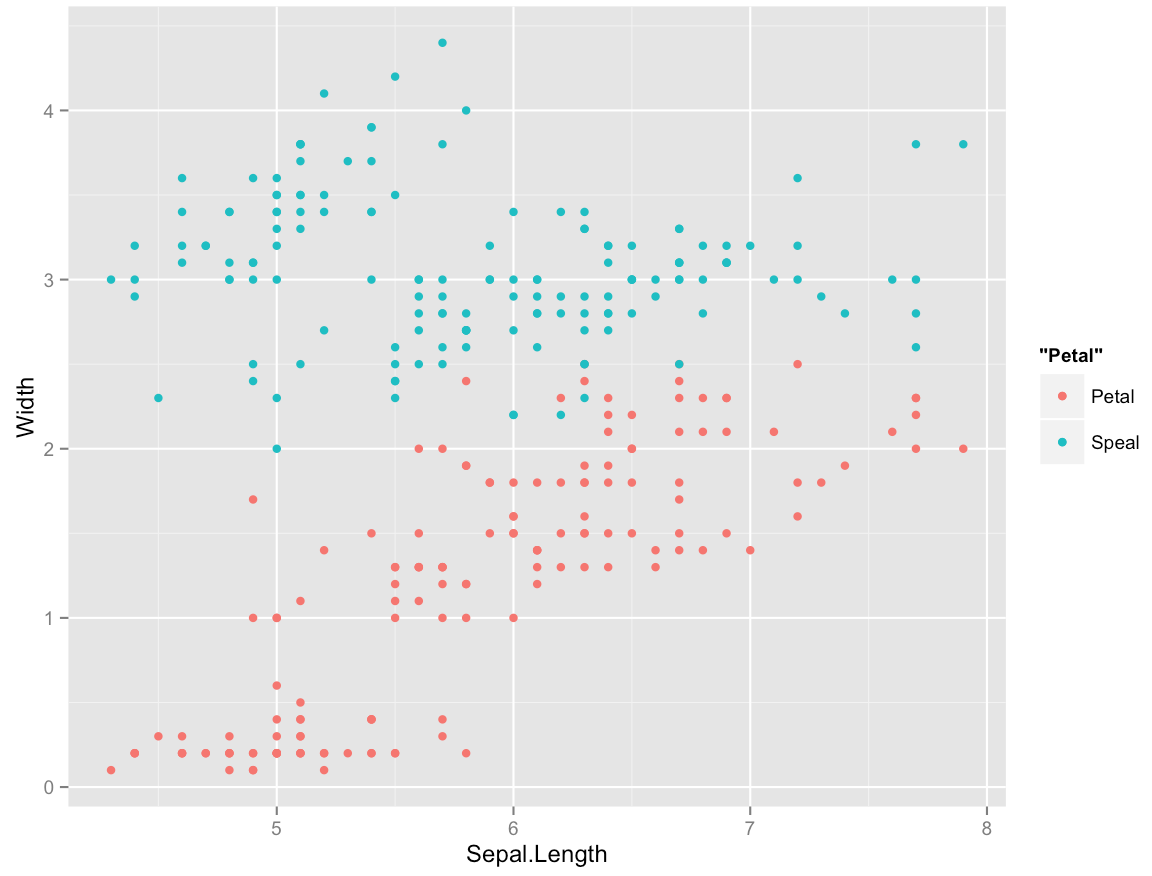 おぉ、。legendのタイトルは適当に直せそうだけど、
色いじれるのか?これ。
おぉ、。legendのタイトルは適当に直せそうだけど、
色いじれるのか?これ。
ggplot(iris, aes(x=Sepal.Length))+
  geom_point(aes(y = Petal.Width, color="Petal"), color="Blue")+
  geom_point(aes(y = Sepal.Width, color="Speal"), color="Red")+
  ylab("Width")
 ん〜〜〜。legendが消えた;;
もう少し複雑な謎
これを$Species$ごとにグラフを分けたい。
ggplot(iris, aes(x=Sepal.Length, color=Species))+
  hogehoge
じゃぁダメだろうな〜。
colorの指定がダブルになっちゃう。
        ,.-─ ─-、─-、
      , イ)ィ -─ ──- 、ミヽ
      ノ /,.-‐'"´ `ヾj ii /  Λ
    ,イ// ^ヽj(二フ'"´ ̄`ヾ、ノイ{
   ノ/,/ミ三ニヲ´        ゙、ノi!
  {V /ミ三二,イ , -─        Yソ
  レ'/三二彡イ  .:ィこラ   ;:こラ  j{
  V;;;::. ;ヲヾ!V    ー '′ i ー ' ソ
   Vニミ( 入 、      r  j  ,′
   ヾミ、`ゝ  ` ー--‐'ゞニ<‐-イ
     ヽ ヽ     -''ニニ‐  /
        |  `、     ⌒  ,/
       |    > ---- r‐'´
      ヽ_         |
         ヽ _ _ 」

     ググレカス [ gugurecus ]
   (西暦一世紀前半~没年不明)
おお!
library(tidyr)
このヒトのお世話になります。
a <- gather(iris, key=low, value=value, -c(Species, Sepal.Length))
ggplot(a, aes(x=Sepal.Length, y=value, color=low))+
  geom_point()+
  facet_wrap( ~Species, scale="free")
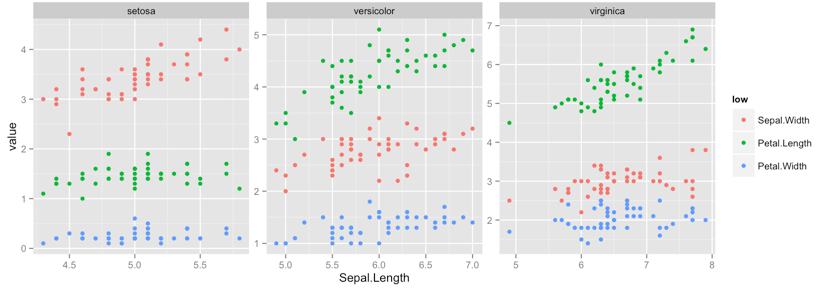
おおー。yes, yes, yes。
色?
色いじりたい???
君、色いじりたいの???
orz
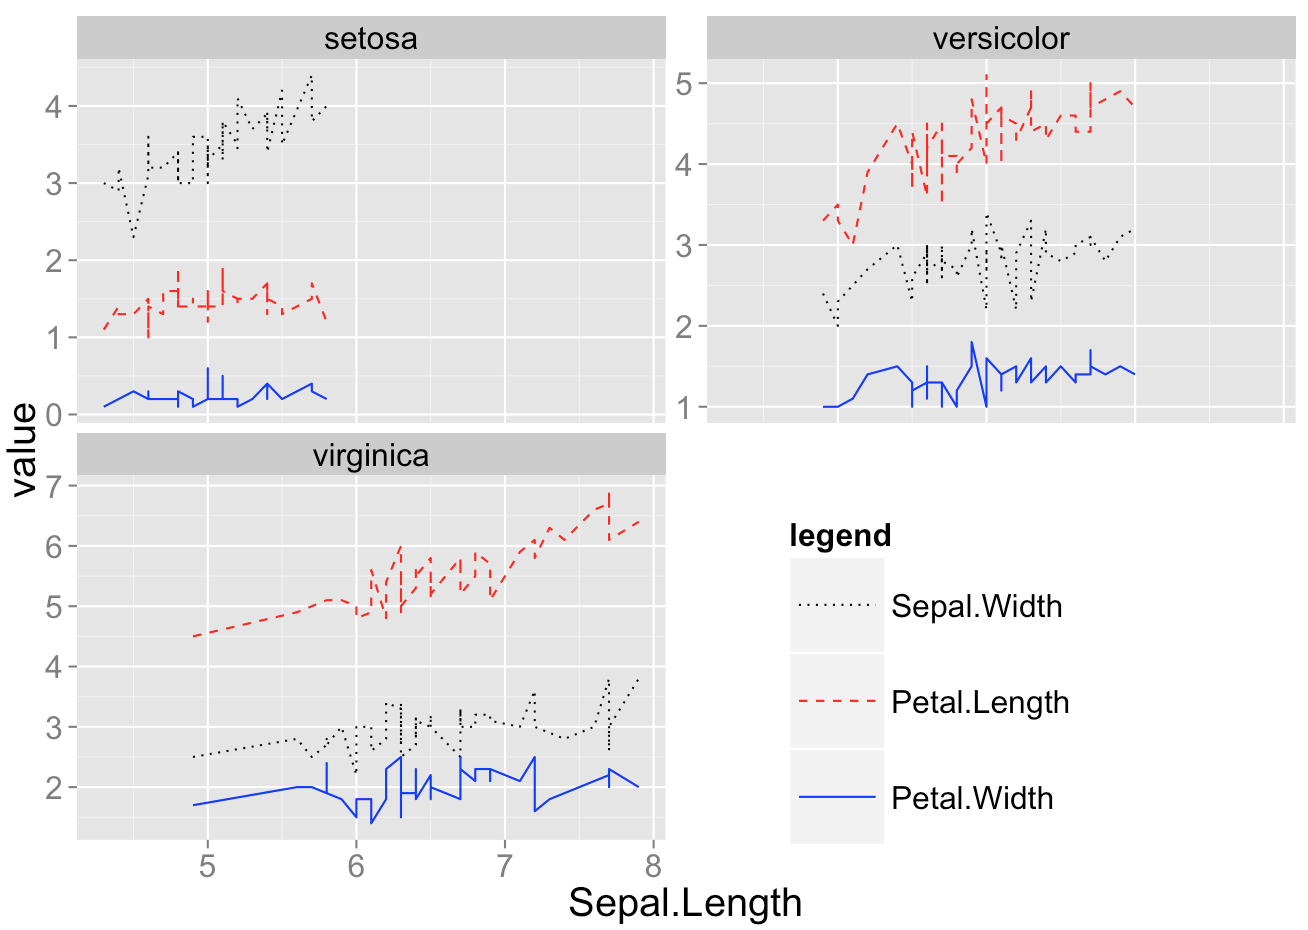
追記(2015/10/26)
yutannihilation様より下記コメントをいただき、お勉強です。
自由度が上がってきました。ありがとうございますm(_ _)m
ggplot(a, aes(x=Sepal.Length, y=value, color=legend))+
  geom_line(aes(linetype=legend))+
  scale_color_manual(values=c(1,2,4))+
  scale_linetype_manual(values=c(3:1))+
  theme(text = element_text(size=20)) +
  facet_wrap( ~Species, scale="free")

その他、使えそうなオプション、
  facet_wrap( ~Species, scale="free_y") # Y軸だけsceleをfree
  theme(legend.position=c(0.7, 0.2)) # 作図画面全体の中での位置
  theme(legend.key.size=unit(2.5, "lines")) # あんま意味分かってない。
     # unitを使うには{grid}が必要
とする。
もう、
やりたい放題