これまでいくつかの記事でnest()あるいはgroup_nest()を使ってデータを畳み込みながら見通しよく解析を進める方法について紹介して来ました。
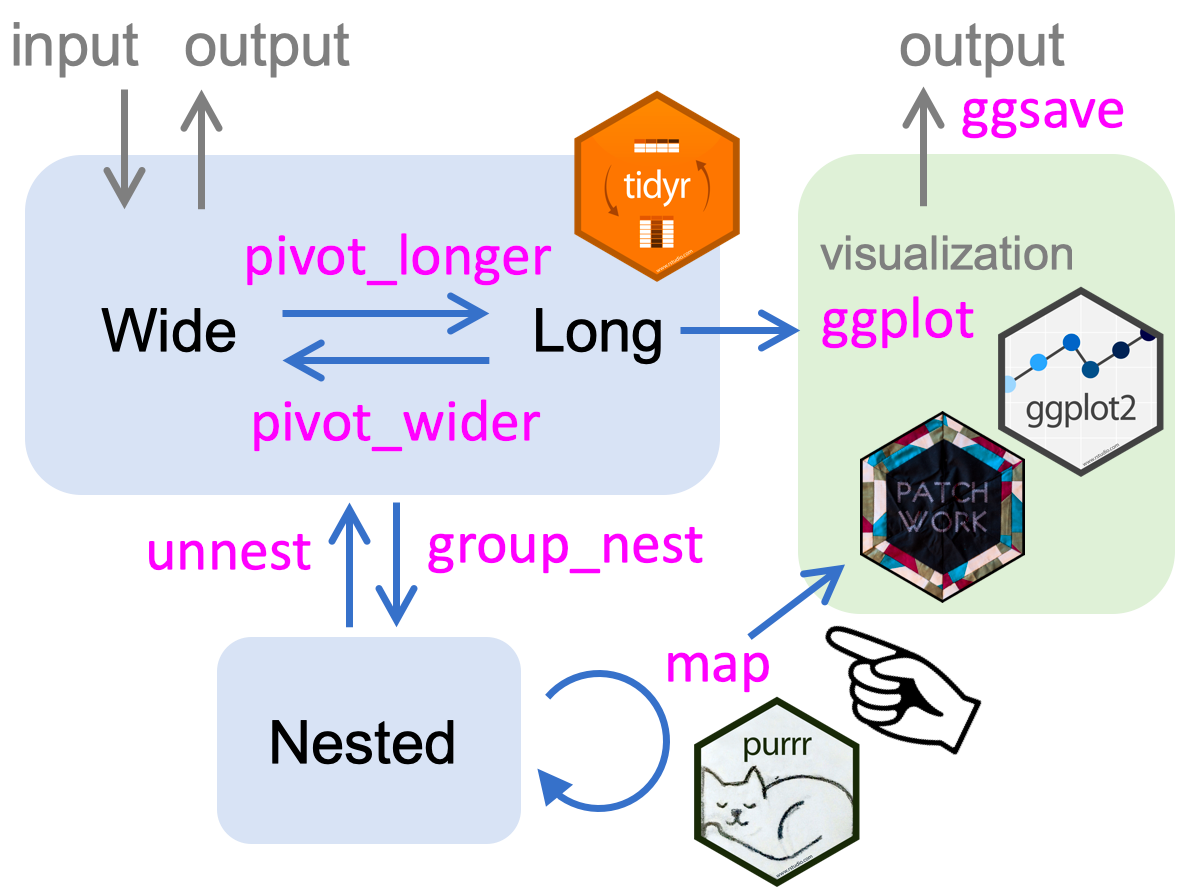
この記事では、ggplot2を使った作図もnested dataの中で完結してしまう方法を紹介します。
右下の指先で示している箇所の話です。
みんな大好きiris
今回もirisのお世話になりましょう。
> iris %>% as.tibble()
# A tibble: 150 x 5
   Sepal.Length Sepal.Width Petal.Length Petal.Width Species
          <dbl>       <dbl>        <dbl>       <dbl> <fct>
 1          5.1         3.5          1.4         0.2 setosa
 2          4.9         3            1.4         0.2 setosa
 3          4.7         3.2          1.3         0.2 setosa
 4          4.6         3.1          1.5         0.2 setosa
 5          5           3.6          1.4         0.2 setosa
 6          5.4         3.9          1.7         0.4 setosa
pivot_*()は履修済みですか?
以前の記事ではデータの縦横変形をする際に、Long→Wideはspread()、Wide→Longはgather()を使いましょうと書いてありますが、最近は新しい関数が追加され、それぞれpivot_wider()とpivot_longer()が便利です。
この乗り換えは最初は抵抗があったのですが、ようやくpivot関数を自然に使えるようになってきました。例えば、こういう変形がサクサク書けます。
library(tidyverse)

iris_long <-
  iris %>%
  pivot_longer(cols = c(starts_with("Sepal"), starts_with("Petal")),
               names_to = c("key", ".value"),
               names_sep = "\\.")

iris_long
> iris_long
# A tibble: 300 x 4
   Species key   Length Width
   <fct>   <chr>  <dbl> <dbl>
 1 setosa  Sepal    5.1   3.5
 2 setosa  Petal    1.4   0.2
 3 setosa  Sepal    4.9   3
 4 setosa  Petal    1.4   0.2
 5 setosa  Sepal    4.7   3.2
 6 setosa  Petal    1.3   0.2
 7 setosa  Sepal    4.6   3.1
 8 setosa  Petal    1.5   0.2
 9 setosa  Sepal    5     3.6
10 setosa  Petal    1.4   0.2
# … with 290 more rows
これをgather()とspread()でやろうとして出来ないことはありませんが、
iris %>%
  rowid_to_column() %>%
  gather("key", "value", -c(Species, rowid))  %>%
  separate(key, into = c("key", "LW")) %>%
  spread(LW, value) %>%
  select(- rowid)
なかなか辛いですね。
この記事ではこれ以上紹介しません。また改めてまとめる日が来るでしょう。
ggplot2の基本
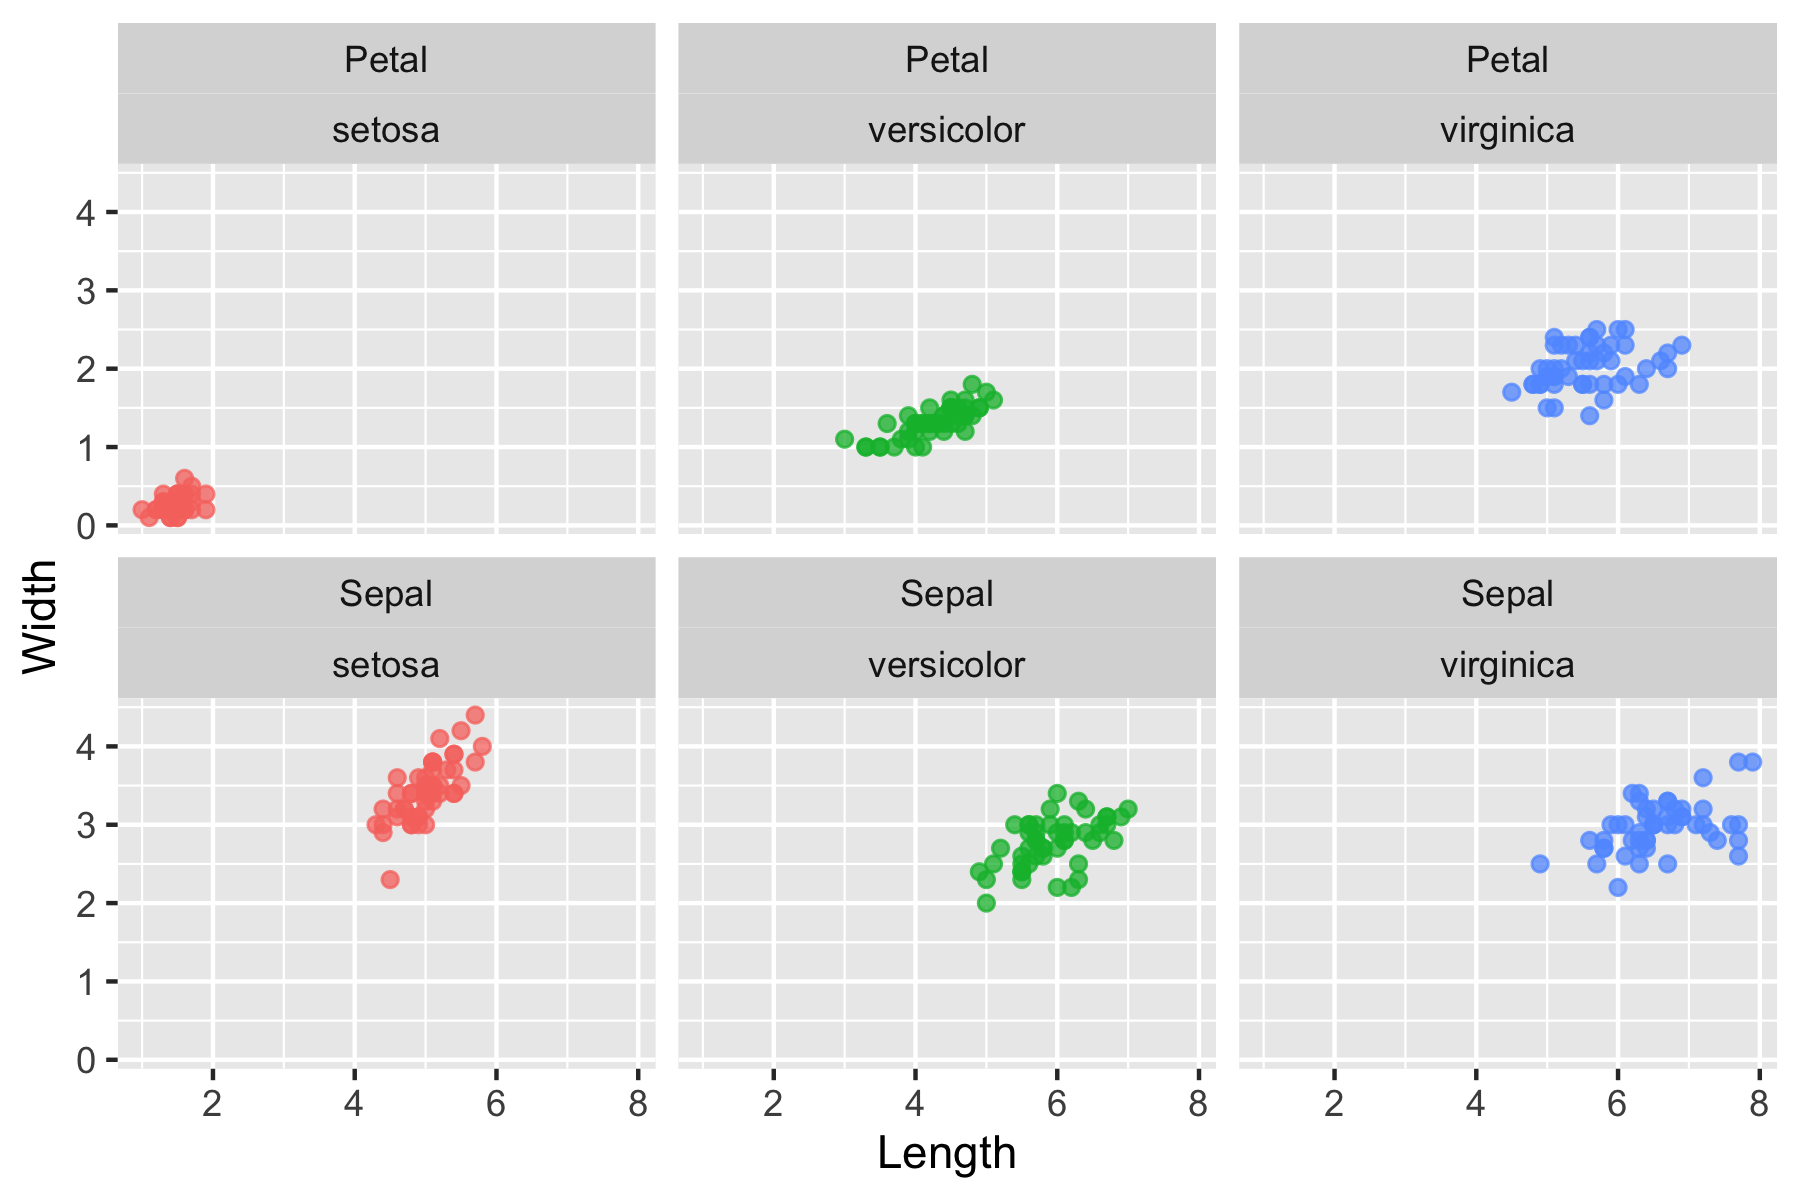
ggplot2パッケージを使った作図では、データから規則的に層別化されたパネルを並べて1枚の図として出力することが簡単にできます。ggplot()への入力には基本的にLong型のデータを使い、各軸に対応するカラムを事前に整形することを心がけます。
ggplot(data = iris_long)+
  aes(x = Length, y = Width, color = Species)+
  geom_point(alpha = 0.75)+
  facet_wrap(key ~ Species)+
  theme(legend.position = "none")
patchworkは履修済みですか?
😱 HOW. HAVE. I. NEVER. HEARD. OF. PATCHWORK?!?!
— Laura Ellis (@LittleMissData) February 16, 2020
So easy to combine multiple #rstats plots into one image. #dataviz https://t.co/x8pQ1tGfd8 pic.twitter.com/Bf3uWxxmcU
第73回Tokyo.Rでatusyさんがggplot2で図を並べる〜facetごり押した私とpatchworkとの出会い〜というタイトルで紹介されて会場がドヨメイたことも記憶に新しいですね。
これを使って、例えば、こんな風にできます。
library(patchwork)

gg_iris <- function(dat){
    dat %>%
      ggplot()+
      aes(Length, Width, color = Species)+
      geom_point(alpha = 0.75)+
      facet_wrap(~ Species)+
      theme(legend.position = "none")
  }

g_Sepal <-
  iris_long %>%
  filter(key == "Sepal") %>%
  gg_iris()+
  labs(title = "Sepal")

g_Petal <-
  iris_long %>%
  filter(key == "Petal") %>%
  gg_iris()+
  labs(title = "Petal")
g_Sepla
g_Sepal / g_Petal
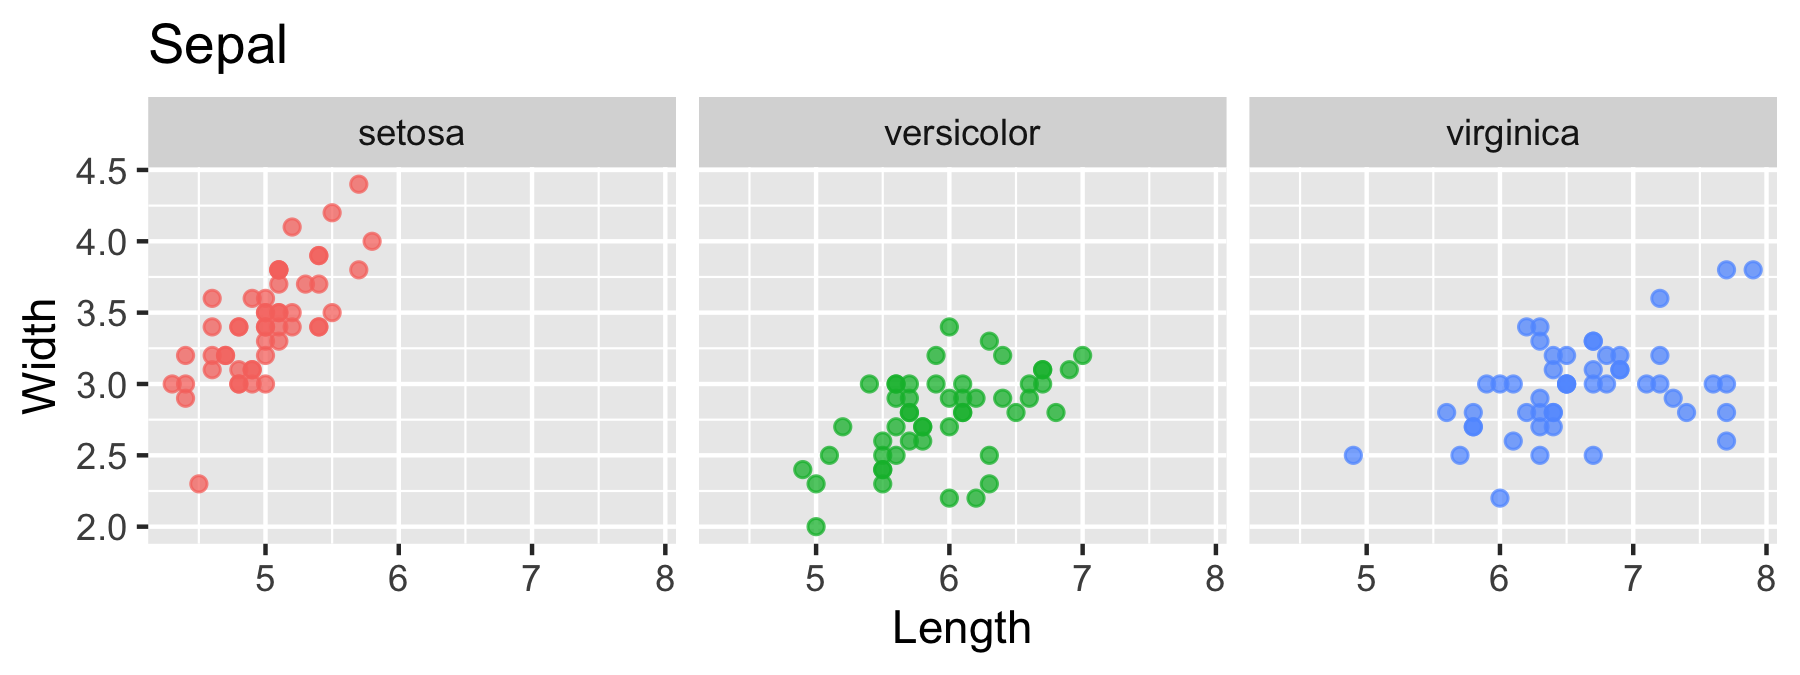
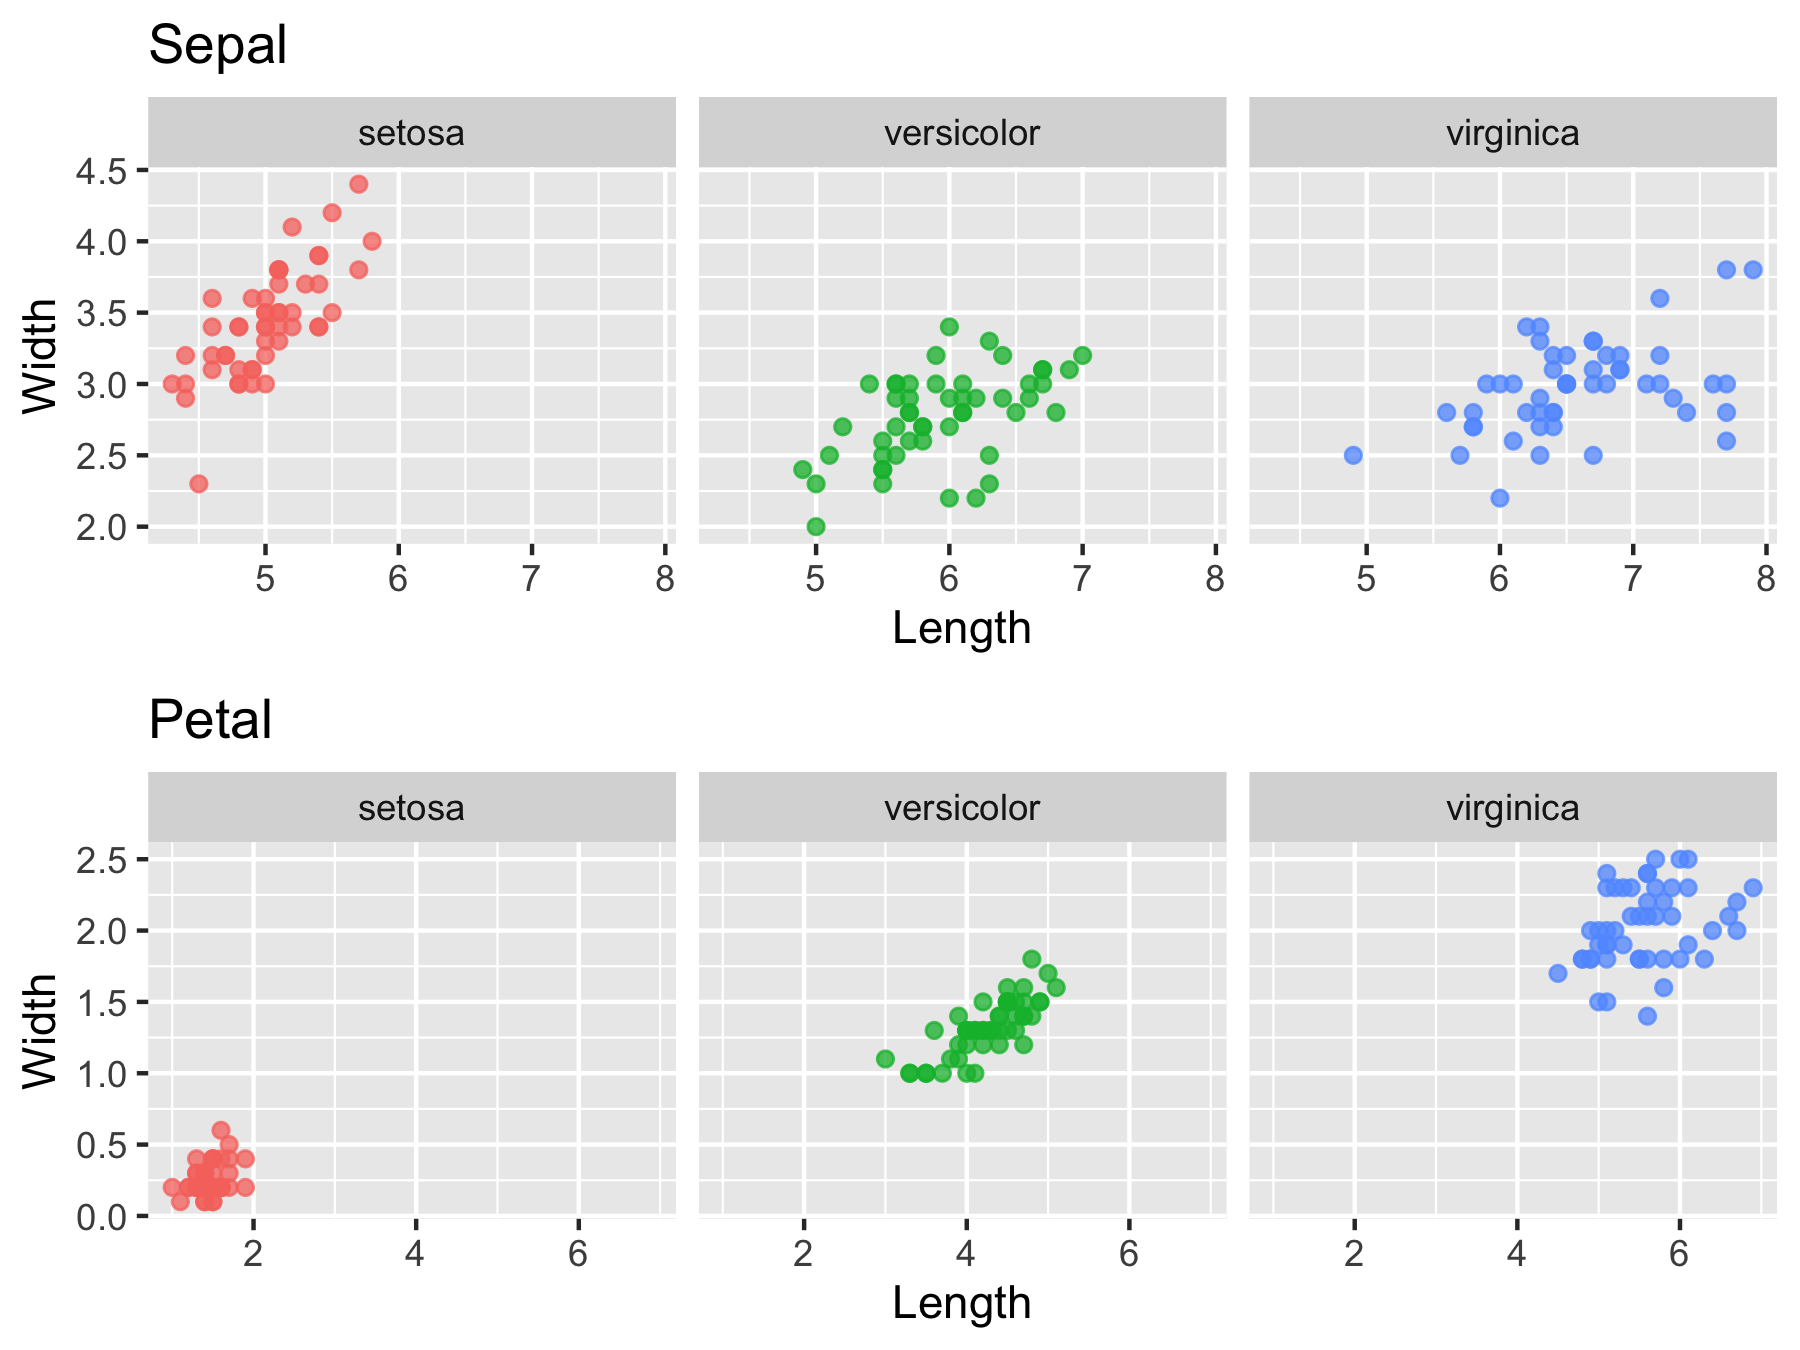
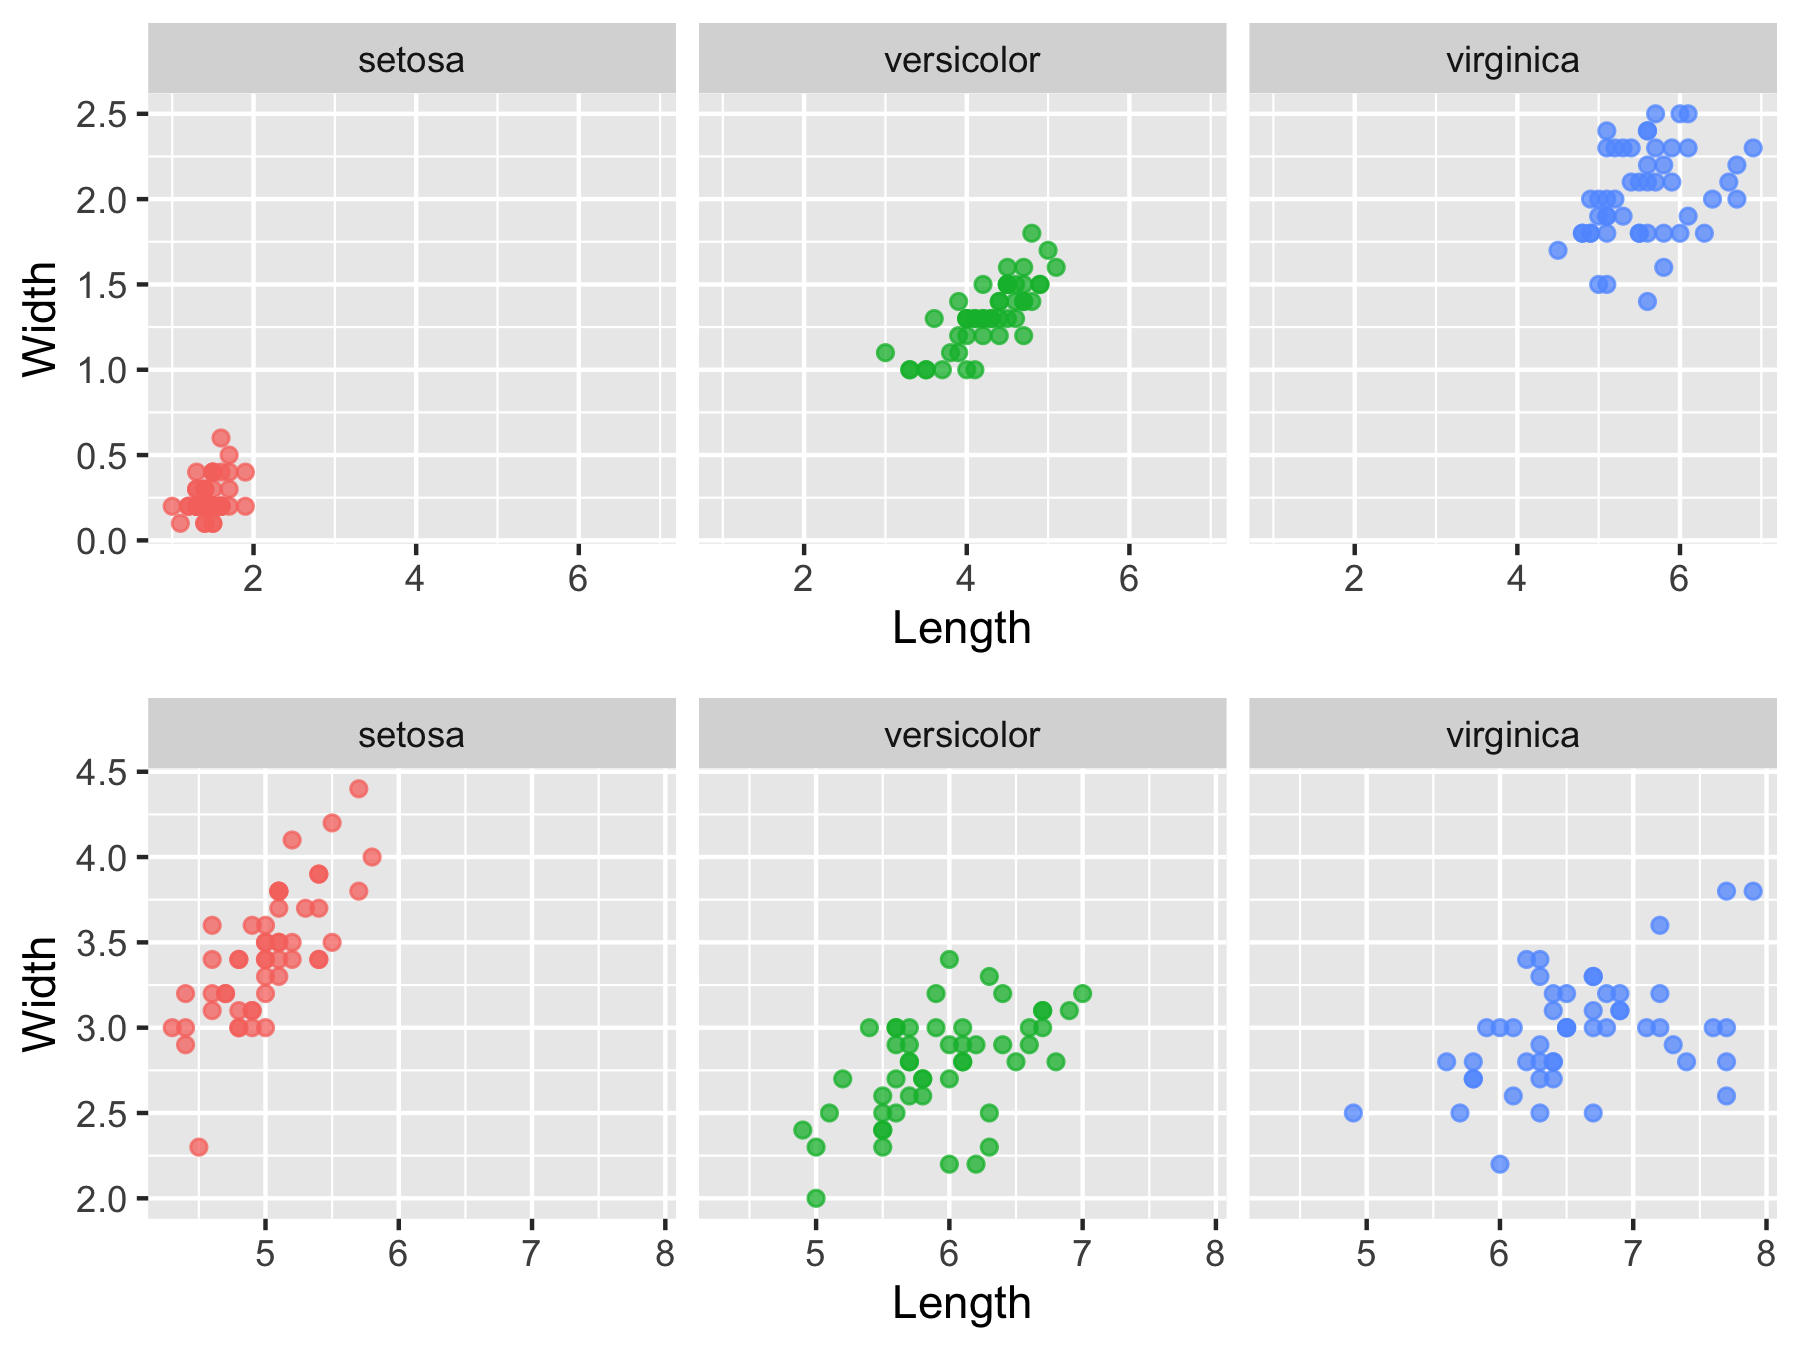
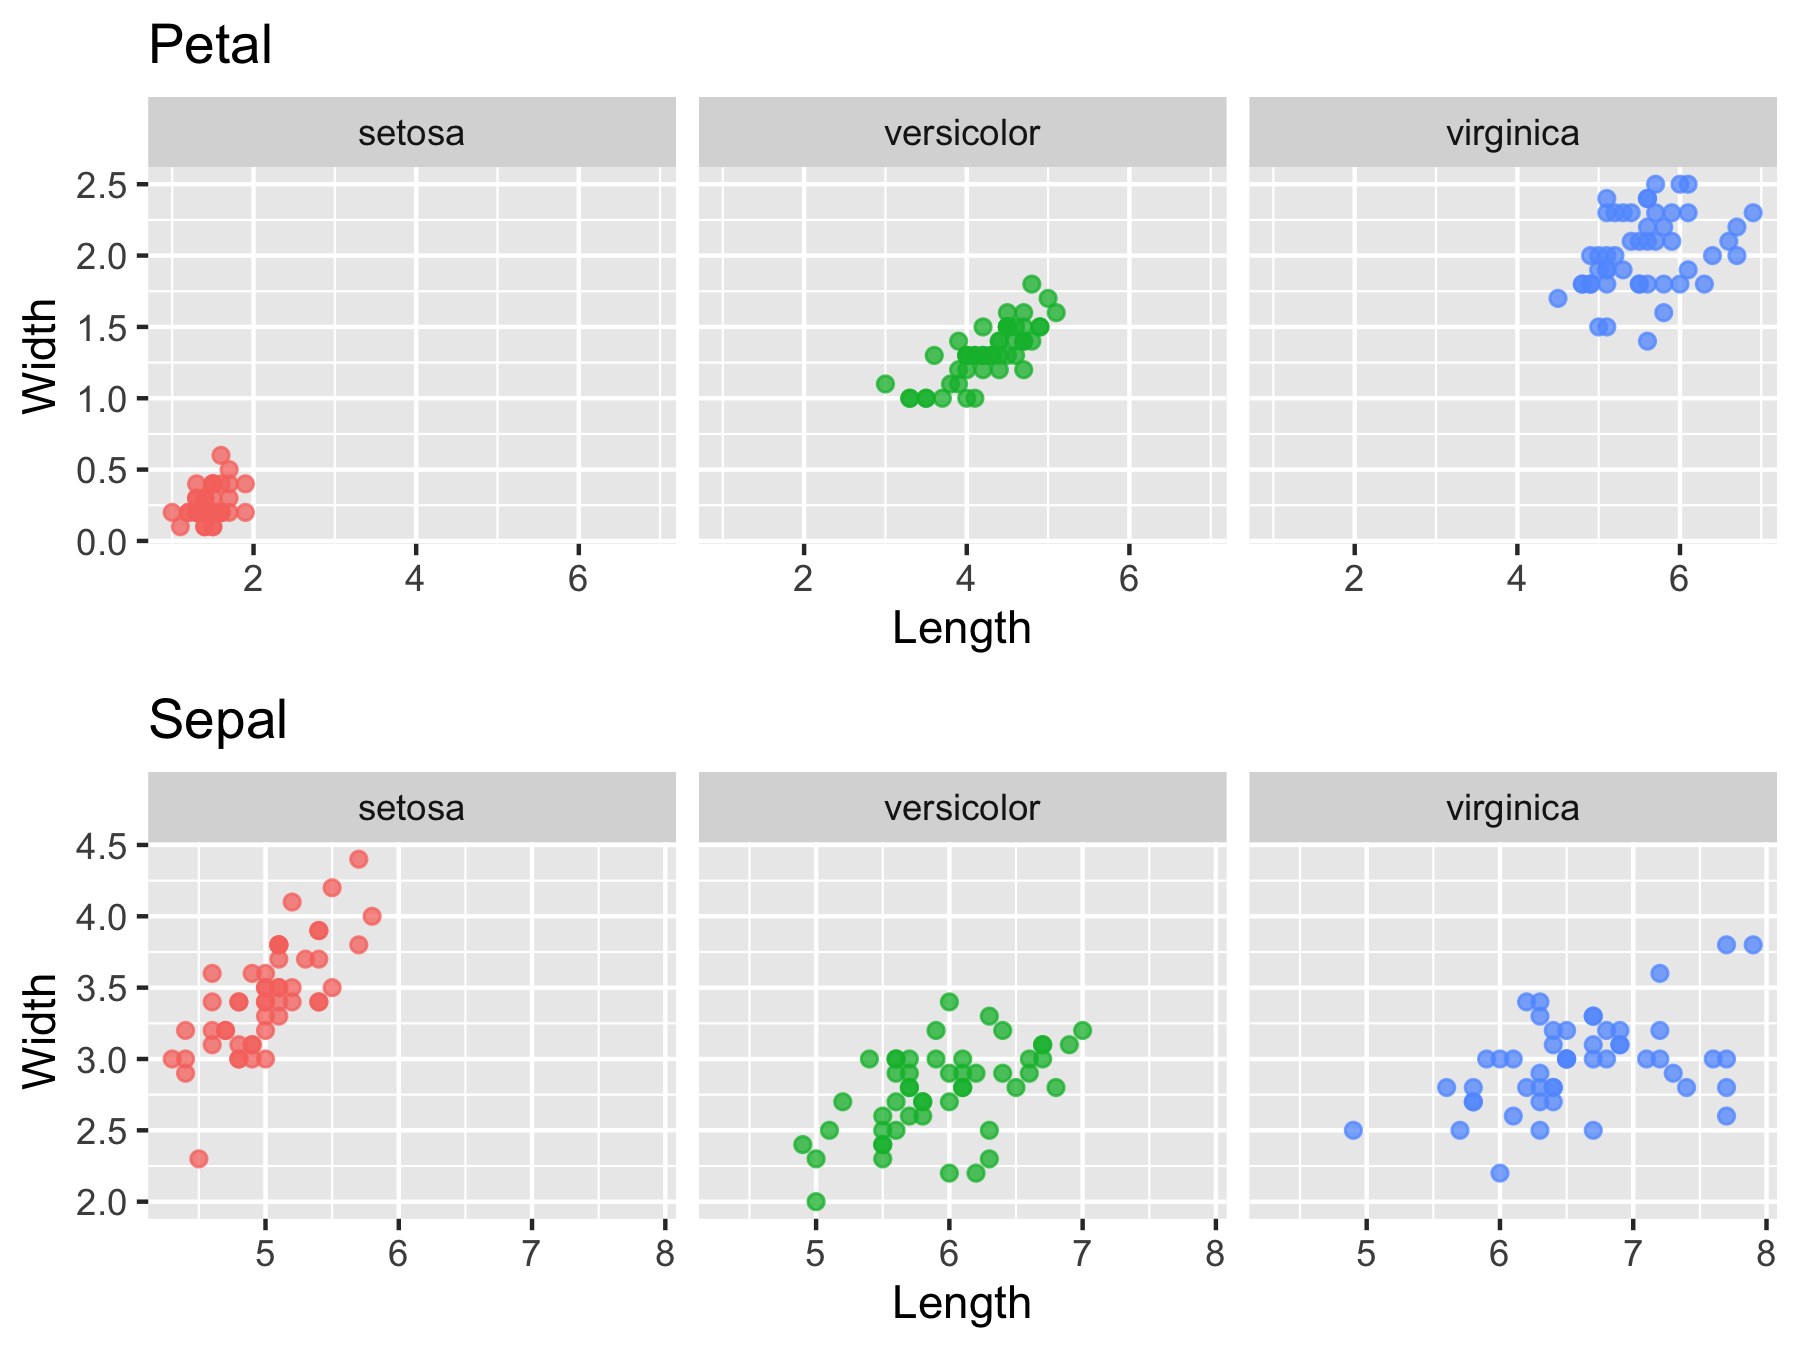
あまり変わっていないように見えますが、Sepal, Petalごとに軸範囲がいい感じになっていて、層別化の水準もスッキリした図になりました。
ちなみに図の出力はwrap_plots()も使えます。
wrap_plots(g_Sepal, g_Petal, nrow = 2)

# もしくは
wrap_plots(list(g_Sepal, g_Petal), nrow = 2)
これは図の保存の時に便利ですね。
g <-
  wrap_plots(g_Sepal, g_Petal, nrow = 2)

ggsave("fig/fig_Sepal_Petal.png", g, width = 6, height = 4.5)
とりあえずnest
2つの全く違う図を作ってpatchworkでくっつけるなら上のような方法で自然なのですが、今回の場合は水準が違うだけで同じ関数で作図していますね。こういう時はfilter()関数でデータを分解するのではなく、nested dataを作ってmap()関数でアクセスしましょうというのが以前の記事で紹介した考え方でした。
やってみましょう。
iris_nest <-
  iris_long %>%
  group_nest(key)
> iris_nest
# A tibble: 2 x 2
  key   data
  <chr> <list>
1 Petal <tibble [150 × 3]>
2 Sepal <tibble [150 × 3]>
> iris_nest$data[[1]]
# A tibble: 150 x 3
   Species Length Width
   <fct>    <dbl> <dbl>
 1 setosa     1.4   0.2
 2 setosa     1.4   0.2
 3 setosa     1.3   0.2
 4 setosa     1.5   0.2
 5 setosa     1.4   0.2
 6 setosa     1.7   0.4
 7 setosa     1.4   0.3
 8 setosa     1.5   0.2
 9 setosa     1.4   0.2
10 setosa     1.5   0.1
# … with 140 more rows
準備完了です。
nested dataの中で作図
通常のnested data加工と同様に、mutate()関数で新しいカラムを作り、そこにmap()関数で作図していきます。
iris_g <-
  iris_nest %>%
  mutate(g = map(data, gg_iris))
> iris_g
# A tibble: 2 x 3
  key   data               g
  <chr> <list>             <list>
1 Petal <tibble [150 × 3]> <gg>
2 Sepal <tibble [150 × 3]> <gg>
めっちゃ簡単ですね。
このように事前にgg_iris()関数を準備していなくても、チルダ~を使って無名関数を定義すれば同じ結果が得られます。
iris_g <-
  iris_nest %>%
  mutate(g = map(data,
                 ~ggplot(.)+
                   aes(Length, Width, color = Species)+
                   geom_point(alpha = 0.75)+
                   facet_wrap(~Species)+
                   theme(legend.position = "none")))
中身はどうなっているかというと、iris_g$g[[1]]とiris_g$g[[2]]に、patchworokで作った時と同じ個別のグラフが入っています。
これらをwrap_plots()関数を使って1つの図にまとめます。
iris_g$g %>%
  wrap_plots(nrow = 2)
おっとtitleを忘れていましたね。
iris_g_title <-
  iris_nest %>%
  mutate(g = map(data, gg_iris)) %>%
  mutate(g = map2(g, key,
                  ~ .x + labs(title = .y)))
iris_g_title$g %>%
  wrap_plots(nrow = 2)
まとめ
データを層別化して畳み込んでおくことで、今、自分がどの水準で何をしようとしているのかを上手く把握できるようになります。データ加工から作図まで、風通しよく進めていきましょう。
