前回までのあらすじ#
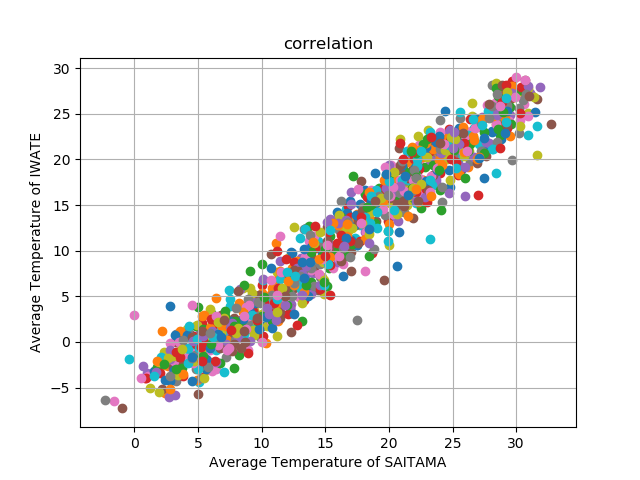
前回でcsvファイルを読み込んで散布図を描画しました
完成したコードと図はこんな感じです
import numpy as np
import matplotlib.pyplot as plt

data_set = np.loadtxt(
    fname="sampleData.csv",
    dtype="float",
    delimiter=",",
)

# 散布図を描画 → scatterを使用する
# 1行ずつ取り出して描画
# plt.scatter(x座標の値, y座標の値)
for data in data_set:
    plt.scatter(data[0], data[1])

plt.title("correlation")
plt.xlabel("Average Temperature of SAITAMA")
plt.ylabel("Average Temperature of IWATE")
plt.grid()

plt.show()
今回やること#
scikit-learnを使用して線形回帰をして回帰直線を描画します
手順##
1 csvからx座標, y座標のデータを取り出す
# x,yのデータを別配列に格納
x = np.array(1) #numpy配列を用意
y = np.array(1) #このとき先頭にいらないデータが入っている
for data in data_set:
    x = np.append(x, data[0]) #appendでデータを追加
    y = np.append(y, data[1])
x = np.delete(x, 0,0) #先頭のいらないデータを削除
y = np.delete(y, 0,0)
2 線形回帰をするモデルに1で取ったx,yをいれる
3 2で作ったモデルで予測を行って直線をつくる
4 matplotlibで描画
scikit-learnってなんぞ#
回帰とか分類とかをしてくれるモジュールです(ザックリ)
詳しくはこちら→公式ページ
線形回帰モデルを使用するコード#
# 線形回帰用のモジュールをインポート
from sklearn.linear_model import LinearRegression

# 回帰直線のx座標用にnumpyのlinspaceで-10から40までの値を均等に100個用意
line_x = np.linspace(-10, 40, 100)

# scikit-learnでの最小二乗法モデルで予測式を求める
model = LinearRegression()
model = model.fit(x.reshape(-1,1), y.reshape(-1,1)) #データをモデルにいれる
model_y = model.predict(line_x.reshape(-1,1)) # 予測
plt.plot(line_x, model_y, color = 'yellow')
model = model.fit(x.reshape(-1,1), y.reshape(-1,1))ですが, 関数の引数に合うようにnumpy配列の形状を変えています
詳しくはこちら
完成したコードと図がこちらです#
import numpy as np
import matplotlib.pyplot as plt
from sklearn.linear_model import LinearRegression

data_set = np.loadtxt(
    fname="sampleData.csv",
    dtype="float",
    delimiter=",",
)
# x,yのデータを別配列に格納
x = np.array(1)
y = np.array(1)
for data in data_set:
    x = np.append(x, data[0])
    y = np.append(y, data[1])
x = np.delete(x, 0,0)
y = np.delete(y, 0,0)


# 散布図を描画
for data in data_set:
    plt.scatter(data[0], data[1])


# scikit-learnでの最小二乗法モデルで予測式を求める
model = LinearRegression()
model = model.fit(x.reshape(-1,1), y.reshape(-1,1))
line_x = np.linspace(-10, 40, 100)
model_y = model.predict(line_x.reshape(-1,1))
plt.plot(line_x, model_y, color = 'yellow')

plt.title("correlation")
plt.xlabel("Average Temperature of SAITAMA")
plt.ylabel("Average Temperature of IWATE")
plt.grid()

plt.show()
ではお疲れ様でした

