1. はじめに
ChatGPT に Code interpreter 機能が公開されてから色々と試していますが、素晴らしいですね! ついにChatGPT 上で簡単なコードの実行 & エラー修正ができるようになりました。
以下の記事で ChatGPTで CSVプロットを行う方法を紹介しましたが、本記事では、Code interpreter を使用することで、この作業がどのくらい簡単になるのか & どのくらい爆速で開発できるようになったかを紹介したいと思います!
2. Code interpreter にCSVの解析を依頼する
2.1. 以前のプロンプトの紹介
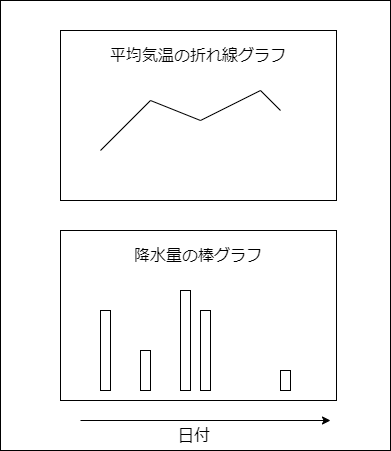
ここでは、気象庁( リンク )からダウンロードできる各地の気象データを使用して、以下のようなプロットを作成します。
ダウンロードしたCSVのサンプルはこちらです。
ダウンロードした時刻:2023/03/30 19:53:27

,大阪,大阪,大阪,大阪,大阪
年月日,平均気温(℃),最高気温(℃),最低気温(℃),降水量の合計(mm),降水量の合計(mm)
,,,,,
,,,,,現象なし情報
2023/3/1,13.1,18.8,6.1,0.5,0
2023/3/2,8.8,13.2,4.9,1.5,0
2023/3/3,7.7,11.6,5.0,0,1
2023/3/4,9.2,16.5,4.1,0,1
実施内容は難しくはないですが、CSVの構造が複雑であるため、以前はCSV読み取りコードを生成してもらうのに苦労しました。
以下が従来のプロンプトで、緑で囲った部分でCSVの読み取り方法を指示していますが、どこを読み込んで、どこをスキップするのかをこと細かに指定する必要がありました。

ここまで細かく指示できるなら、自分でコードも書けるんじゃ...と思いながらプロンプトを書いていました。
2.2. Code interpreter の使用例
では、Code interpreter を使用して、CSVの読み込みを行ってみましょう。

CSVファイルを貼り付けて「pandasで読み込んでください」と依頼すると、ChatGPTが解析を始めます。
以下長くなりますが、初めて実施したときに感激したので、すべての結果を貼り付けています。


最後に表示されているResultで、正しくCSVを読み込むことができたことが確認できます。
実行結果についての補足
- ChatGPTが内部でJupyter notebook上にPythonコードを書いて、Pythonコードを実行しているようで、エラーが発生すると自動的に修正が入ります。
- 列名の重複によるエラーは、もともとの記事(こちら)でも発生し、解決になかなか苦労したのですが、自動的に自分で解決方法を見つけて対応していました。
プロンプトのポイント
- プロンプトで指示したのは文字コードと区切り文字と、補足情報になります。区切り文字を省略すると、エラー→対応→エラーのように無限ループが発生したので、明示的に指定することにしました。
- 文字コードは指定しなくても、まずUTF-8を試したあと、エラーが出た場合は、ChatGPT が自動的に (日本語の場合) Shift-JISを試していました。回答時間短縮のために書いています。
冒頭に指示した数行でここまで自動で解析してしまうのかと、いよいよコードを自分で書く必要がなくなってきました...
3. プロットしてもらう
3.1. プロット用のコードの出力
CSVの読み込みができたので、プロット用のコードを生成してもらいます。

import pandas as pd
from collections import Counter
import matplotlib.pyplot as plt

def get_header(file_path, encoding, skiprows):
    """
    This function reads the first few lines of the file to get the headers.
    Then it combines the necessary lines to form the new headers and returns it.
    """
    with open(file_path, 'r', encoding=encoding) as f:
        header_lines = [next(f) for _ in range(skiprows)]
    header = [a.strip() + b.strip() for a, b in zip(header_lines[2].split(','), header_lines[3].split(','))]
    return header

def make_header_unique(header):
    """
    This function makes the header unique by appending indices to duplicate header names.
    """
    header_counter = Counter(header)
    duplicates = [k for k, v in header_counter.items() if v > 1]
    header_unique = []
    for h in header:
        if h in duplicates:
            counter = 1
            new_h = h
            while new_h in header_unique:
                new_h = f"{h}_{counter}"
                counter += 1
            header_unique.append(new_h)
        else:
            header_unique.append(h)
    return header_unique

def load_data(file_path, encoding, skiprows, header):
    """
    This function reads the data from the CSV file using the given headers and returns the DataFrame.
    """
    df = pd.read_csv(file_path, encoding=encoding, skiprows=skiprows, names=header)
    return df

def plot_data(df):
    """
    This function plots the data in a 2-subplot figure.
    The first plot is a line plot of average temperature, and the second plot is a bar plot of total precipitation.
    """
    fig, ax = plt.subplots(2, 1, figsize=(10, 8))

    # Convert '年月日' to datetime
    df['年月日'] = pd.to_datetime(df['年月日'])

    # Plot average temperature
    ax[0].plot(df['年月日'], df['大阪平均気温(℃)'])
    ax[0].set_ylabel('Average Temperature (℃)')
    ax[0].set_title('Average Temperature Over Time')

    # Plot total precipitation
    ax[1].bar(df['年月日'], df['大阪降水量の合計(mm)'], width=0.5)
    ax[1].set_ylabel('Total Precipitation (mm)')
    ax[1].set_title('Total Precipitation Over Time')

    # Adjust x-axis labels
    plt.setp(ax[0].xaxis.get_majorticklabels(), rotation=45)
    plt.setp(ax[1].xaxis.get_majorticklabels(), rotation=45)

    # Adjust layout
    plt.tight_layout()

    # Show the plots
    plt.show()

def main():
    file_path = './data.csv'
    encoding = 'shift_jis'
    skiprows_for_header = 5
    skiprows_for_data = 6
    header = get_header(file_path, encoding, skiprows_for_header)
    header_unique = make_header_unique(header)
    df = load_data(file_path, encoding, skiprows_for_data, header_unique)
    plot_data(df)

if __name__ == "__main__":
    main()
これを実行すると以下のプロットが出力されます。

Code interpreter を使う前は、いろいろなエラーで苦労していたのが、2回指示をするだけで完了しました!
3.2. 画面上に表示してもらう
matplotlib を使って、直接 ChatGPT の画面上に結果を出すこともできます。

(Plotlyのグラフは画面に出すことはできないようです。)
4. おわりに
以下の記事を書いたときは,CSVデータの読み取りに苦労したので、「Webアプリ化」の方だけ爆速を付けようかと変な位置に入れたことを思い出していました。今回の結果で、CSVデータの可視化も爆速になりました。
Code interpreter が楽しすぎて、寝てる場合じゃねえと、急いで2本書いたので、もう一本もよろしければどうぞ!
まだまだ活用しきれていない気がするので、なにか見つけたら報告します!