アニメーションで理解する最小二乗法###
Pythonを使った回帰分析の概念の解説 その1では、データに最適な直線を描くには、最小二乗法を使い、直線とデータの差(誤差)を最小にするようにパラメーターを設定することを説明しました。
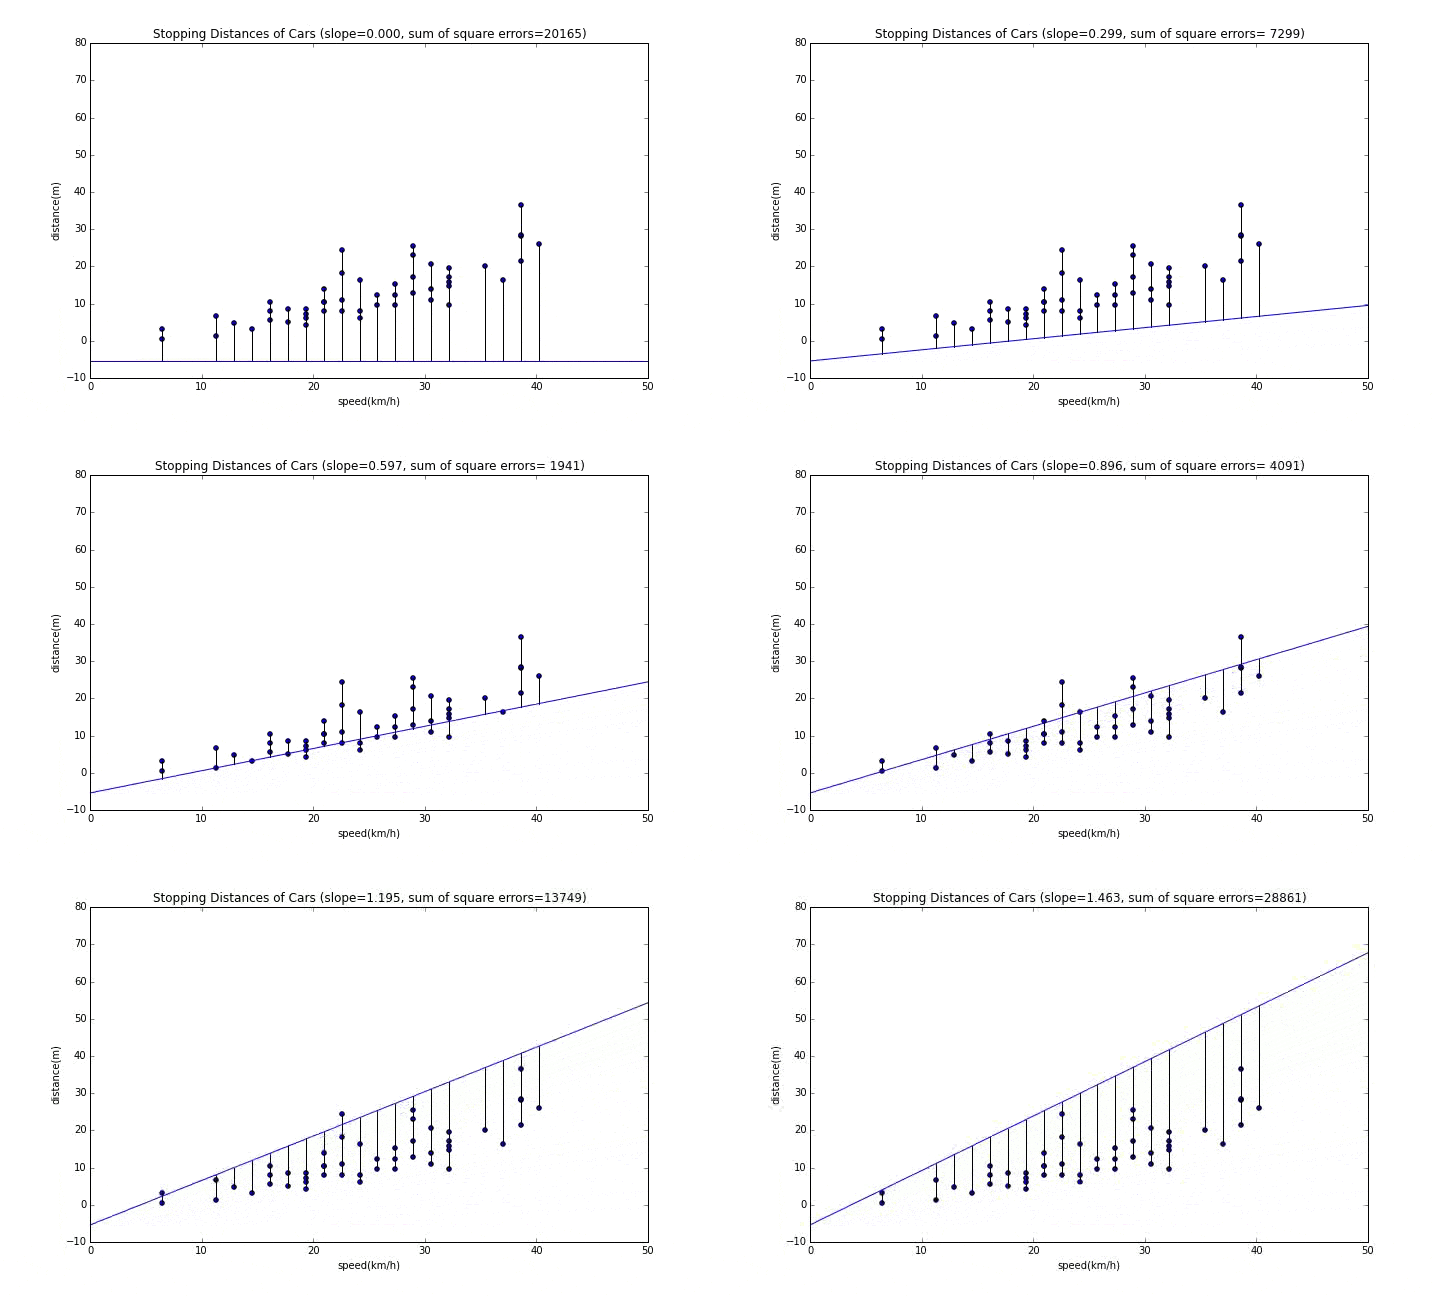
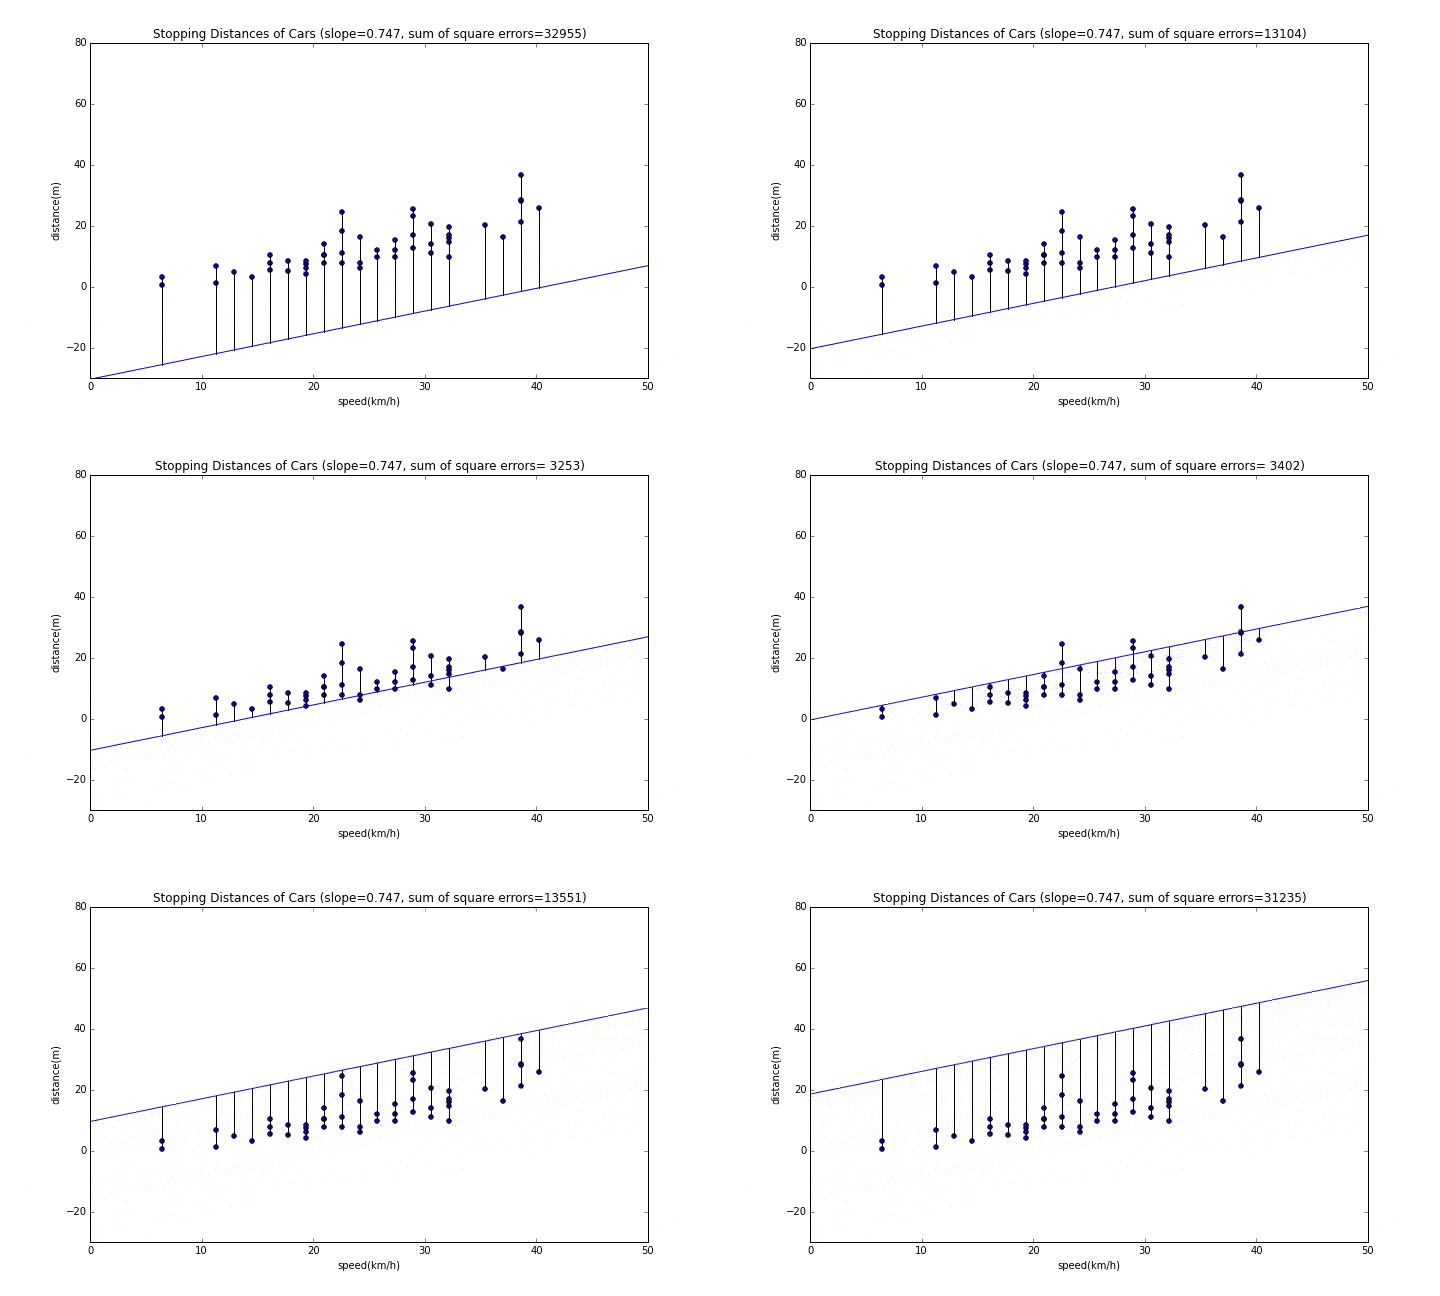
ここではその番外編として、各パラメータが変わっていく様をアニメーションにしてグラフを描画してみました。こうしてみるとイメージが湧くかと思います。
グラフのタイトルにある"sum of square errors"が誤差の二乗和なので、これが最小となるところが一番良い位置になります。
傾きが変わっていく様子
まずは傾きが変わっていく様子を見てみます。
matplotlibでアニメーションを出力するためにmatplotlib.animation.FuncAnimation関数を使っています。グラフを描画する関数を外出しして、引数にアニメーションで変化させる値をとるようにします。ここではanimate関数を作っています。このanimate関数はFuncAnimation関数内で呼ばれ、nframeに0からframesで設定した値を順番に引数に設定され呼ばれます。
import numpy as np
import matplotlib.pyplot as plt
from moviepy.editor import *
from matplotlib import animation as ani

data= np.loadtxt('cars.csv',delimiter=',',skiprows=1)
data[:,1] = map(lambda x: x * 1.61, data[:,1])    # mph から km/h に変換
data[:,2] = map(lambda y: y * 0.3048, data[:,2])  # ft から  m に変換

def animate(nframe):
    plt.clf()        # clear graph canvas
    slope = 0.746606334842 * (float(nframe)/50) *2   # 引数のnframeが変わることによりslopeが変わる
    intercept = - 5.41583710407
    x = np.linspace(0,50,50)
    y = slope * x + intercept
    plt.ylim(-10,80)
    plt.xlim(0,50)
    plt.xlabel("speed(km/h)")
    plt.ylabel("distance(m)")
    plt.scatter(data[:,1],data[:,2])
    # draw errors
    se = 0
    i = 0
    for d in data:
        plt.plot([d[1],d[1]],[d[2],d[1]*slope+intercept],"k")
        se += (y[i] - d[2]) ** 2
        i += 1
    plt.title("Stopping Distances of Cars (slope=%.3f, sum of square errors=%5d)" % (slope, se))
    # based line: y = 0.74x -5
    plt.plot(x,y)


fig = plt.figure(figsize=(10,6))

anim = ani.FuncAnimation(fig, animate, frames=50, blit=True)

anim.save('regression_anim.mp4', fps=13)

clip = VideoFileClip("regression_anim.mp4")
clip.write_gif("regression_anim.gif")
切片が変わっていく様子
先ほどと変わって、切片が動きます。
def animate(nframe):
    plt.clf()        # clear graph canvas
    slope = 0.746606334842
    intercept = -5.41583710407 + (float(nframe-25)/50) * 50   # 引数のnframeが変わることによりinterceptが変わる
    x = np.linspace(0,50,50)
    y = slope * x + intercept
    plt.ylim(-30,80)
    plt.xlim(0,50)
    plt.xlabel("speed(km/h)")
    plt.ylabel("distance(m)")
    plt.scatter(data[:,1],data[:,2])
    # draw errors
    se = 0
    i = 0
    for d in data:
        plt.plot([d[1],d[1]],[d[2],d[1]*slope+intercept],"k")
        se += (y[i] - d[2]) ** 2
        i += 1
    plt.title("Stopping Distances of Cars (slope=%.3f, sum of square errors=%5d)" % (slope, se))
    # based line: y = 0.74x -5
    plt.plot(x,y)


fig = plt.figure(figsize=(10,6))

anim = ani.FuncAnimation(fig, animate, frames=50, blit=True)

anim.save('regression_anim_i.mp4', fps=13)

clip = VideoFileClip("regression_anim_i.mp4")
clip.write_gif("regression_anim_i.gif")

