統計学において、正規分布というのは非常に重要な役割を果たしています。その正規分布をあらわす数式(密度関数)は
\Phi(x) = \frac{1}{\sqrt{2\pi\sigma^2}}\exp \left( -\frac{(x-\mu)^2}{2\sigma^2} \right)
なのですが、これは非常に複雑な数式です・・・
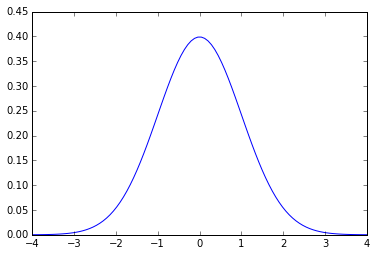
分散$\sigma^2 = 1$, 平均$\mu=0$である標準正規分布にすると少し簡単に見えます。
\phi(x) = \frac{1}{\sqrt{2\pi}}\exp \left( -\frac{x^2}{2} \right)
グラフにするとこんな感じです。いわゆる釣鐘型ですね。
(以下、pythonで適宜グラフを書いていきます)
import matplotlib.pyplot as plt
import numpy as np

x = np.linspace(-4,4, 100)
y = (1/np.sqrt(2*np.pi))*np.exp(-x**2/2)

plt.ylim(0,0.45)
plt.plot(x,y)
plt.show()
そもそも正規分布は、なめらかかつ、左右対称で、どこか1点に集まっている関数で確率を表したい、というところが原点と思います。
なので、思い切って2次関数
f(x) = x^2
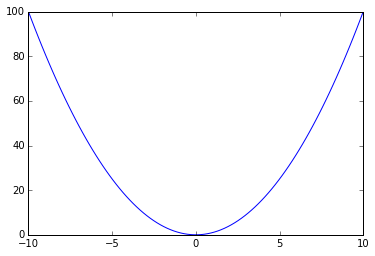
としてグラフで描いみると、
import matplotlib.pyplot as plt
import numpy as np

x = np.linspace(-10,10, 100)
y = x**2

plt.plot(x,y)
plt.show()
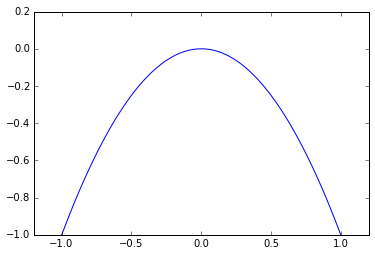
うーん、下むいちゃいましたね。これだと分布にならないのでマイナスをかけて上を向かせましょう。
f(x) = -x^2
x = np.linspace(-1,1, 100)
y = -x**2

plt.xlim(-1.2,1.2)
plt.ylim(-1,0.2)
plt.plot(x,y)
plt.show()
ちょっとそれっぽくなってきました。これを裾を伸ばして釣鐘型にするには$e$の上に乗っけます。
f(x) = e^{-x^2}
x = np.linspace(-1,1, 100)
y = np.exp(-x**2)

plt.xlim(-1.5,1.5)
plt.ylim(0,1.2)
plt.plot(x,y)
plt.show()
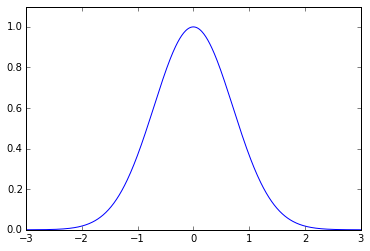
形はもう完全に正規分布です。この正規分布の形の大元は$e^{-x^2}$だったのです。
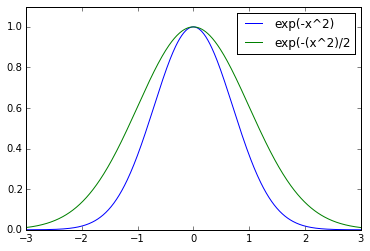
あとは、微分した時に計算しやすいように$x$を$1/\sqrt{2}$します。つまり、$y = \sqrt{2}x$と変数変換します。
g(y) = \exp \left(-\frac{y^2}{2} \right)
x = np.linspace(-3,3, 500)
y1 = np.exp(-(x**2))
y2 = np.exp(-(x**2)/2)

plt.xlim(-3,3)
plt.ylim(0,1.1)
plt.plot(x,y1,"b", label="exp(-x^2)")
plt.plot(x,y2,"g", label="exp(-(x^2)/2")
plt.legend()
plt.show()
ちょっと横に広がりました。
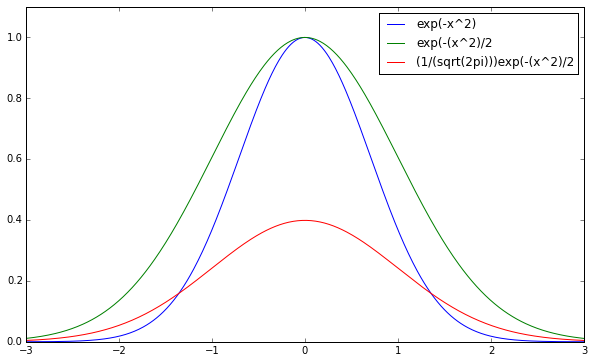
このf(x)の面積が1となるように(確率なので、すべてのありえる事象をたすと100%になるので)積分して1となるようにする必要があります。
ガウス積分(Wikipedia参照)より、$x$の全範囲について積分した値は、
\int_{-\infty}^{\infty} e^{-x^2}dx = \sqrt{\pi}
なので、変数変換$y = \sqrt{2}x$を適用すると
\int_{-\infty}^{\infty} \exp \left( {-\frac{y^2}{2}}\right)dy = \sqrt{2\pi}
です。両辺を$\sqrt{2\pi}$で割って、
\int_{-\infty}^{\infty} \frac{1}{\sqrt{2\pi}} \exp \left( {-\frac{y^2}{2}}\right)dy = 1
標準正規分布の式が得られました ![]()
x = np.linspace(-1,1, 100)
y = np.exp(-(x**2)/2)

plt.xlim(-1.5,1.5)
plt.ylim(0,1.2)
plt.plot(x,y)
plt.show()
この式は、$e^{-x^2}$をもとに、積分して面積を求めると1になるように調整したものだったのです。
