1.中心極限定理とは#
統計学を勉強していると、中心極限定理という何やらお堅い名前の定理が出てきます。Wikipedia先生によると、
大数の法則によると、ある母集団から無作為抽出された標本平均はサンプルのサイズを大きくすると真の平均に近づく。これに対し中心極限定理は標本平均と真の平均との誤差を論ずるものである。多くの場合、母集団の分布がどんな分布であっても、その誤差はサンプルのサイズを大きくしたとき近似的に正規分布に従う。
http://ja.wikipedia.org/wiki/中心極限定理
と書かれているのですが、よくわからないですね^^;
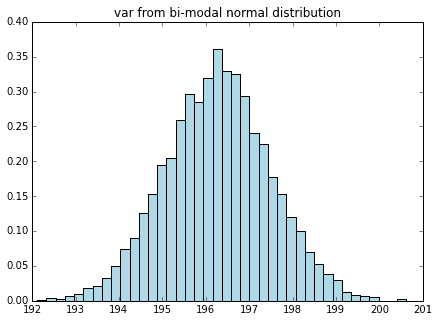
元の分布が、どんな形であれ、そこから取り出した標本の標本平均は正規分布に近いものになる、と言うことですね。標本分散も同じく正規分布に近いものになるそうです。(正確に言うとカイ二乗分布に従いNが多いと正規分布で近似できる)
言葉で説明しても、数式で証明した(積率母関数が一致するとかなんとか)としても直感的にはよく理解できないと思うので、グラフを書いて理解してみようというのがこの記事の目的です。
2. グラフ描画用の準備#
Pythonをつかってグラフを書いていきますが、そのための準備処理が下記になります。
各種ライブラリのインポートと、グラフ描画の関数を準備しています。
%matplotlib inline
import matplotlib.pyplot as plt
import numpy as np
import numpy.random as rd
import matplotlib.mlab as mlab
import scipy.stats as st

# サンプル用パラメータ
n = 10000
sample_size = 10000

# サンプルごとの平均、分散を算出する関数
def sample_to_mean_var(sample):
    mean = np.mean(sample)
    var  = np.var(sample)
    return [mean, var]

# 平均、分散のヒストグラムを描画する関数
def plot_mean_var(stats, dist_name=""):
    mu = stats[:,0]
    var = stats[:,1]
    bins = 40

    # 標本平均のヒストグラム
    plt.figure(figsize=(7,5))
    plt.hist(mu, bins=bins, normed=True, color="plum")
    plt.title("mu from %s distribution"%(dist_name))
    plt.show()

    # 標本分散のヒストグラム
    plt.figure(figsize=(7,5))
    plt.hist(var, bins=bins, color="lightblue", normed=True)
    plt.title("var from %s distribution"%(dist_name))
    plt.show()

def plot_dist(data, bins, title =""):
    plt.figure(figsize=(7,5))
    plt.title(title)
    plt.hist(data, bins, color="lightgreen", normed=True)
    plt.show()
3.描画する#
3-1. 指数分布##
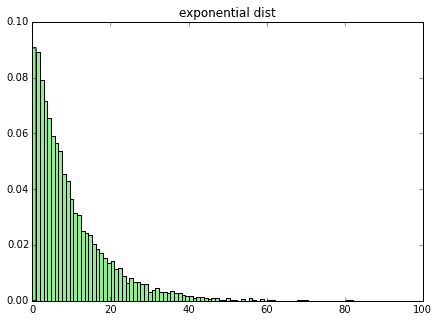
まずは指数分布を試してみます。指数分布のパラメータ$\lambda$を0.1、10,000個のサンプルを生成してグラフを書いたものが下記となります。右に裾が長い完全に左右非対称な分布です。
# 指数分布のグラフ描画
lam = 0.1
x = rd.exponential(1./lam, size=sample_size)
plot_dist(x, 100, "exponential dist")
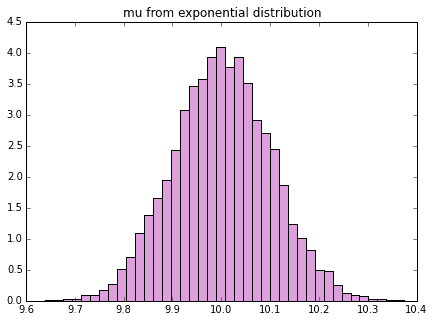
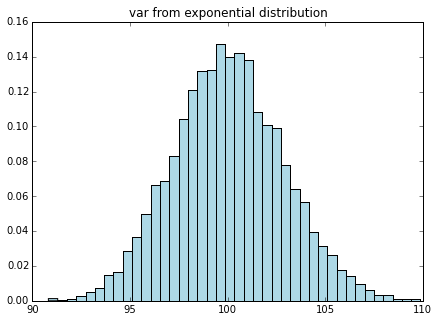
この、10,000個のサンプルを1セットとして、ここから標本平均、標本分散を算出します。これをさらに10,000回繰り返してその標本平均、標本分散のヒストグラムを書くと下記になります。
# 指数分布をたくさん生成して標本平均、標本分散のヒストグラムを描画
lam = 0.1
stats = np.array([sample_to_mean_var(rd.exponential(1./lam, size=sample_size)) for i in range(n)])
plot_mean_var(stats, dist_name="exponential")
どうでしょう、元の分布はかなり歪んでいましたが、標本平均、標本分散は綺麗な左右対称の釣鐘型になっていそうですね。これが正規分布に従っている、ということが中心極限定理なのです。
以下、他の歪んだグラフでも試してみます。
3-1. カイ二乗分布##
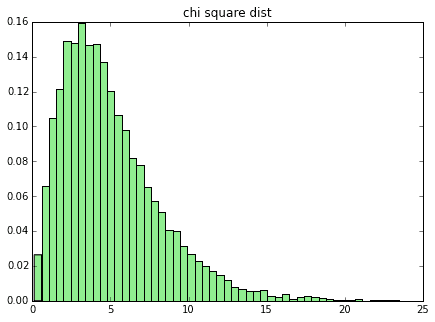
次にカイ二乗分布です。これも結構歪んでいます。
# 自由度5のカイ二乗分布
df = 5
x = rd.chisquare(df, sample_size)
plot_dist(x, 50, "chi square dist")
# カイ二乗分布の平均、分散のヒストグラム
df = 5   # 自由度

# カイ二乗分布をたくさん生成
chi_stats = np.array([sample_to_mean_var(rd.chisquare(df, sample_size)) for i in range(n)])
plot_mean_var(chi_stats, dist_name="chi square")
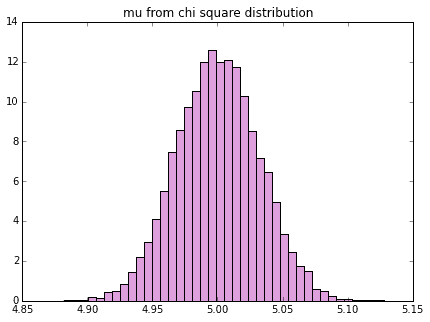
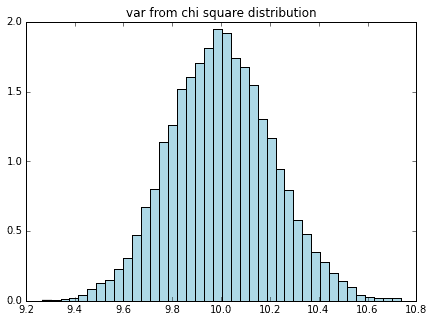
これもやはり、左右対称な釣鐘型のヒストグラムが書けていることがわかります。
3-1. 双峰正規分布##
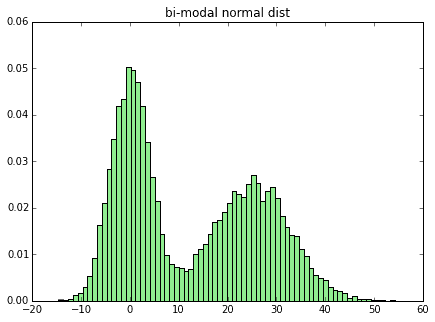
山が2つあるような変な形の分布も試してみます。
# 双峰正規分布
def generate_bimodal_norm():
    x = np.random.normal(0, 4, sample_size)
    y = np.random.normal(25, 8, sample_size)
    return np.append(x,y)

z = generate_bimodal_norm()
plot_dist(z, 70, "bi-modal normal dist")
# 双峰正規分布の平均、分散のヒストグラム

# 双峰正規分布をたくさん生成
binorm_stats = np.array([sample_to_mean_var(generate_bimodal_norm()) for i in range(n)])
plot_mean_var(binorm_stats, dist_name="bi-modal normal")
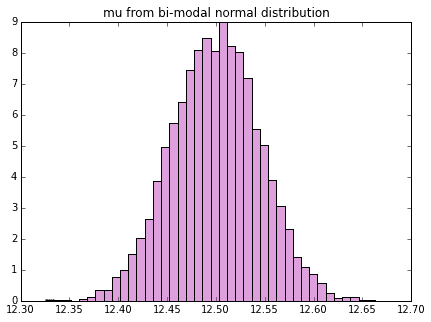
こんな分布でさえ、標本平均、標本分散は正規分布するのです。すごいですね、中心極限定理w
4.おわりに#
ということで、数式や証明を見ると難しそうな中心極限定理ですが、グラフで見て直感的に理解することを試みてみました。統計学で正規分布が重要と言われる所以はここにあるようですね ![]()
