Matplotlibとは?
グラフが描画できるライブラリ
機械学習のデータの可視化などに利用される
CIFAR-10とは?
32×32サイズの画像6万枚が10種類のラベルとセットで含まれている
画像とラベルの種類はairplane,automobile,bird,cat,deer,dog,frog,horse,ship,truckの10種類
実際にmatplotlibで表示させて遊んでみる
1.データをインポート
kerasを使ってCIFAR-10の画像をインポートします
(※kerasはインストール済みの状態とします)
from keras.datasets import cifar10
(x_train,y_train),(x_test,y_test) = cifar10.load_data()
機械学習での学習用とテスト用のデータなので(x_train,y_train),(x_test,y_test)となっています(※詳しい話は割愛)
2. Matplotlibをインポート
from matplotlib import pyplot as plt
3. CIFAAR-10の画像データを表示させる
例:1枚目の画像を表示させる場合
plt.imshow(x_train[0])
plt.show()
JupyterNotebookで手順1から試していくと
1枚目の画像
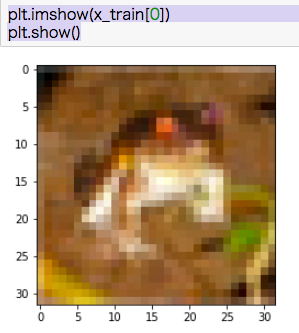
かえる(frog)・・・?
4枚目
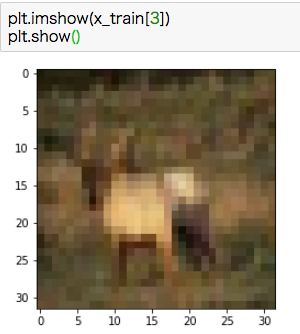
これは鹿(deer)っぽい
40枚目
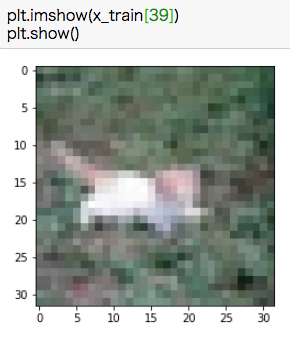
ん〜ー。
(※正解のラベルはy_trainに付いてます)