前回でほぼグラフの描写が終わりました。今回は凡例のアイテムが変わった場合にうまく描写する方法と書式設定を見ていきます。
ハードコードの課題
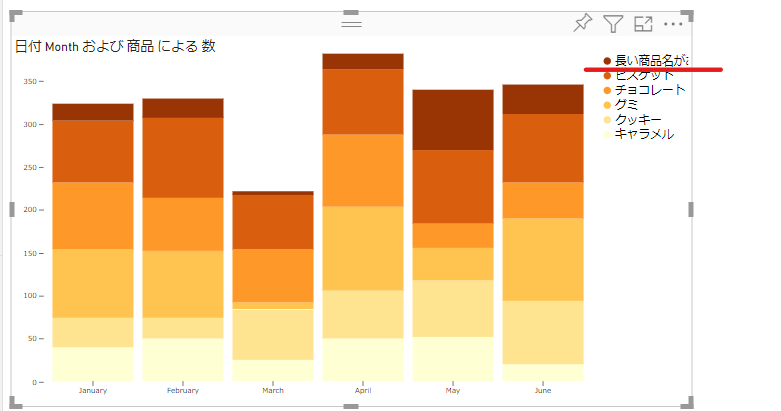
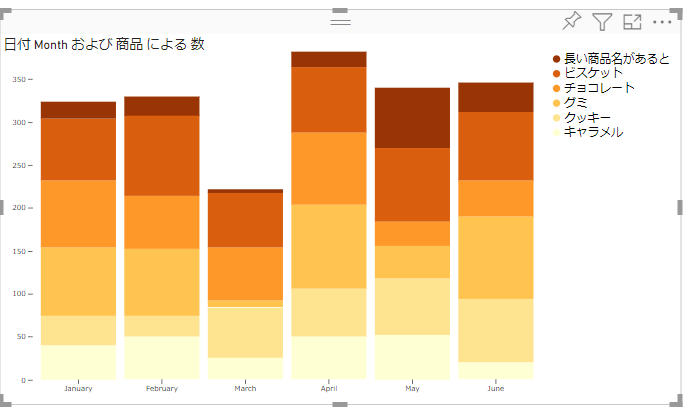
現在凡例の場所はハードコードされているため、商品名が入らない、もしくはスペースが無駄になる場合があります。

また X 軸、Y 軸のフォントサイズもハードコードされていて変更できません。これらを解消していきます。
文字列の長さを計算
powerbi-visuals-utils-formattingutils にある機能を利用できます。
1. モジュールをインストール。
npm install powerbi-visuals-utils-formattingutils
2. visual.ts に import を追加。
import { textMeasurementService } from "powerbi-visuals-utils-formattingutils";
3. update 関数で legends を取得したコードの下に、以下コードを追加。
- フォントサイズとフォントファミリーを指定して幅を予測
- circle や余白のために 40 追加
let legendTextWidth = textMeasurementService.measureSvgTextWidth({
    text: legends
        .slice()
        .sort((a, b) => b.length - a.length)[0],
    fontSize: "16px",
    fontFamily: "'Segoe UI',wf_segoe-ui_normal,helvetica,arial,sans-serif"
});
4. マージンを変更。
let margin = { top: 0, bottom: 30, left: 40, right: legendTextWidth + 40 }
5. カスタムビジュアルで動作確認。
書式
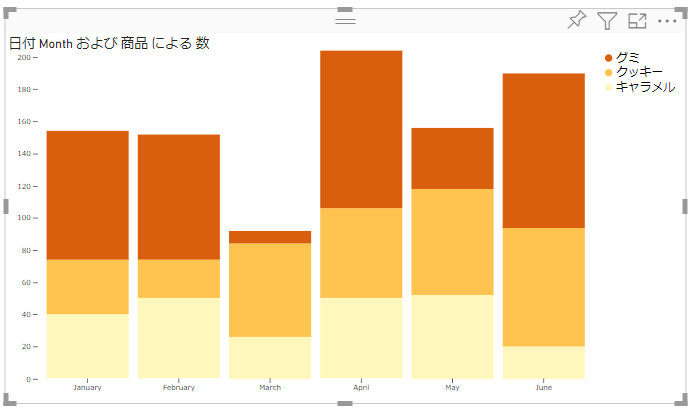
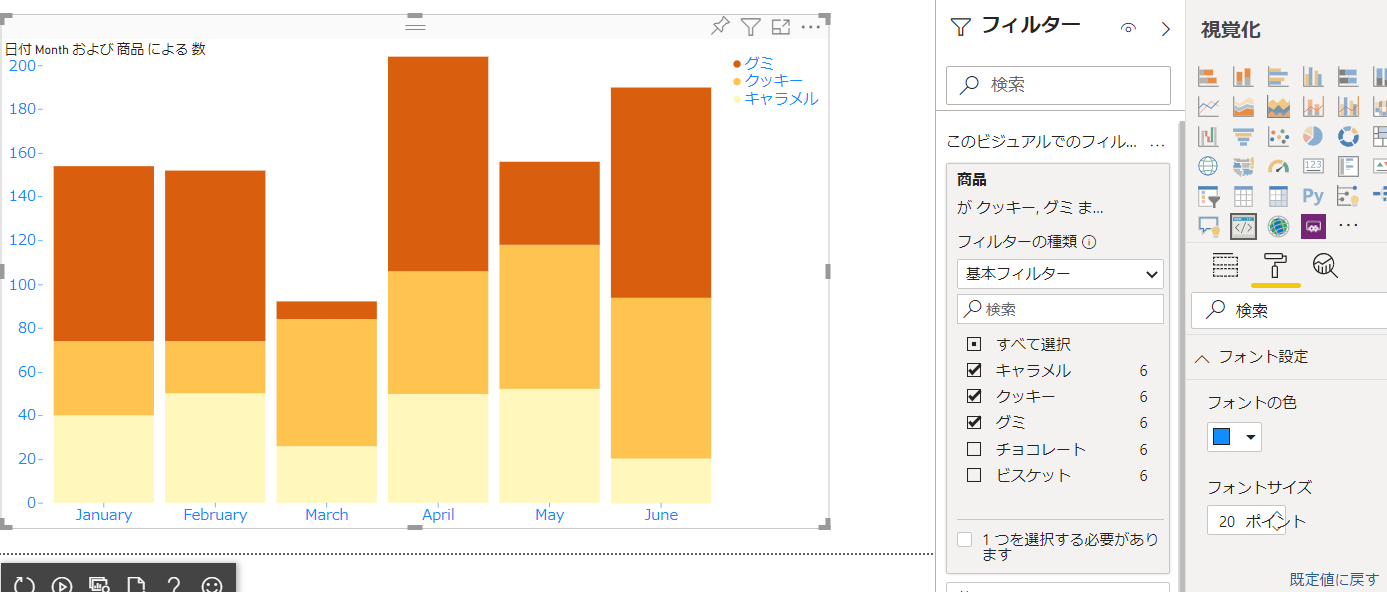
次に X 軸、Y 軸、凡例のフォントサイズを指定できるようにします。
1. capabilities.json に objects を追加。
{
    "dataRoles": [
        {
            "displayName": "軸",
            "name": "axis",
            "kind": "Grouping"
        },
        {
            "displayName": "凡例",
            "name": "legend",
            "kind": "Grouping"
        },
        {
            "displayName": "値",
            "name": "measure",
            "kind": "Measure"
        }
    ],
    "objects": {
        "fontSettings": {
            "displayName": "フォント設定",
            "properties": {
                "fontSize": {
                    "displayName": "フォントサイズ",
                    "type": {
                        "formatting": {
                            "fontSize": true
                        }
                    }
                },
                "fontColor": {
                    "displayName": "フォントの色",
                    "type": {
                        "fill": {
                            "solid": {
                                "color": true
                            }
                        }
                    }
                }
            }
        }
    },
    "dataViewMappings": [
        {
            "conditions": [
                {
                    "axis": {
                        "max": 1
                    },
                    "legend": {
                        "max": 1
                    },
                    "measure": {
                        "max": 1
                    }
                }
            ],
            "matrix": {
                "rows": {
                    "for": {
                        "in": "axis"
                    }
                },
                "columns": {
                    "for": {
                        "in": "legend"
                    }
                },
                "values": {
                    "select": [
                        {
                            "for": {
                                "in": "measure"
                            }
                        }
                    ]
                }
            }
        }
    ]
}
2. 対応するように src/settings.ts を更新。
"use strict";

import { dataViewObjectsParser } from "powerbi-visuals-utils-dataviewutils";
import DataViewObjectsParser = dataViewObjectsParser.DataViewObjectsParser;

export class VisualSettings extends DataViewObjectsParser {
  public fontSettings: fontSettings = new fontSettings();
}

export class fontSettings {
  public fontColor: string = "";
  public fontSize: number = 16;
}
3. visual.ts で設定を取得。update 関数の一番初めに以下コードを追加。
this.settings = Visual.parseSettings(options.dataViews[0]);
4. ハードコードされている部分を改修。最終的な update 関数は以下の通り。
public update(options: VisualUpdateOptions) {
    debugger;
    this.settings = Visual.parseSettings(options.dataViews[0]);
    let viewModel = this.converData(options);

    let axises = viewModel.dataPoints.map(d => d.axis).filter((element, index, array) => {
        return array.indexOf(element) === index
    });
    let legends = viewModel.dataPoints.map(d => d.legend).filter((element, index, array) => {
        return array.indexOf(element) === index
    });

    let legendTextWidth = textMeasurementService.measureSvgTextWidth({
        text: legends
            .slice()
            .sort((a, b) => b.length - a.length)[0],
        fontSize: `${this.settings.fontSettings.fontSize}px`,
        fontFamily: "'Segoe UI',wf_segoe-ui_normal,helvetica,arial,sans-serif"
    });

    let yTextWidth = textMeasurementService.measureSvgTextWidth({
        text: viewModel.maxValue.toString(),
        fontSize: `${this.settings.fontSettings.fontSize}px`,
        fontFamily: "'Segoe UI',wf_segoe-ui_normal,helvetica,arial,sans-serif"
    });

    let width = options.viewport.width;
    let height = options.viewport.height;
    let margin = { top: 0, bottom: 30, left: yTextWidth+20, right: legendTextWidth + 40 }

    this.svg
        .attr("width", width)
        .attr("height", height);


    let x = d3.scaleBand()
        .domain(axises)
        .range([margin.left, width - margin.right])
        .padding(0.1);

    let y = d3.scaleLinear()
        .domain([0, viewModel.maxValue])
        .rangeRound([height - margin.bottom, margin.top]);

    let color = d3.scaleOrdinal()
        .domain(legends)
        .range(d3.schemeYlOrBr[legends.length])
        .unknown("#ccc");

    this.stackBarContainer.selectAll('rect')
        .data(viewModel.dataPoints)
        .join('rect')
        .attr('fill', d => color(d.legend).toString())
        .attr("x", (d, i) => x(d.axis.toString()))
        .attr("y", d => y(d.value2))
        .attr("height", d => y(viewModel.maxValue - d.value))
        .attr("width", x.bandwidth());

    let xAxis = g => g
        .attr("transform", `translate(0,${height - margin.bottom})`)
        .style("color", this.settings.fontSettings.fontColor)
        .style("font-size", this.settings.fontSettings.fontSize)
        .attr("fill", this.settings.fontSettings.fontColor)
        .call(d3.axisBottom(x).tickSizeOuter(0))
        .call(g => g.selectAll(".domain").remove());
    this.xAxis.call(xAxis);

    let yAxis = g => g
        .attr("transform", `translate(${margin.left},0)`)
        .style("color", this.settings.fontSettings.fontColor)
        .style("font-size", this.settings.fontSettings.fontSize)
        .attr("fill", this.settings.fontSettings.fontColor)
        .call(d3.axisLeft(y).ticks(null, "s"))
        .call(g => g.selectAll(".domain").remove());
    this.yAxis.call(yAxis);

    let legend = svg => {
        let g = svg
            .attr("transform", `translate(${width - margin.right}, 0)`)
            .selectAll("g")
            .data(legends.reverse())
            .join("g")
            .attr("transform", (d, i) => `translate(0,${i *
                (Number.parseInt(this.settings.fontSettings.fontSize.toString()) + 4)})`)

        g.call(g => g.selectAll("circle").remove());
        g.call(g => g.selectAll("text").remove());

        g.append("circle")
            .attr("cx", 20)
            .attr("cy", 10)
            .attr("r", 5)
            .attr("fill", d => color(d));

        g.append("text")
            .attr("fill", this.settings.fontSettings.fontColor)
            .attr("font-size", this.settings.fontSettings.fontSize)
            .attr("x", 30)
            .attr("y", 9.5)
            .attr("dy", "0.35em")
            .text(d => d);
    }
    this.legend.call(legend);
}
まとめ
今回で積み上げ棒グラフを作ってみるシリーズは終わりです。他のグラフとのインタラクションやハイライトなど、自由に追加してみてください。


