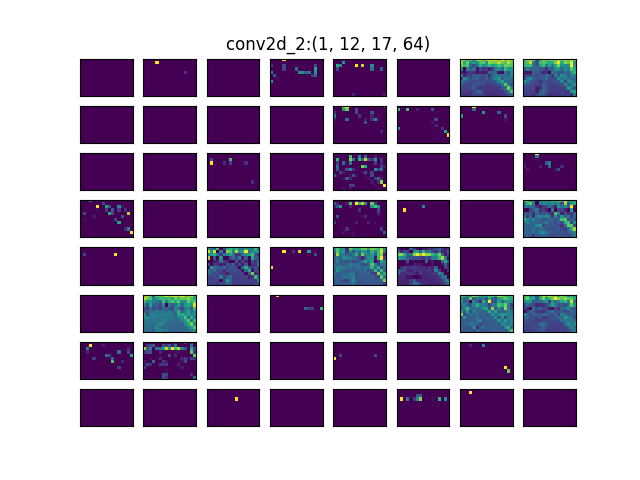
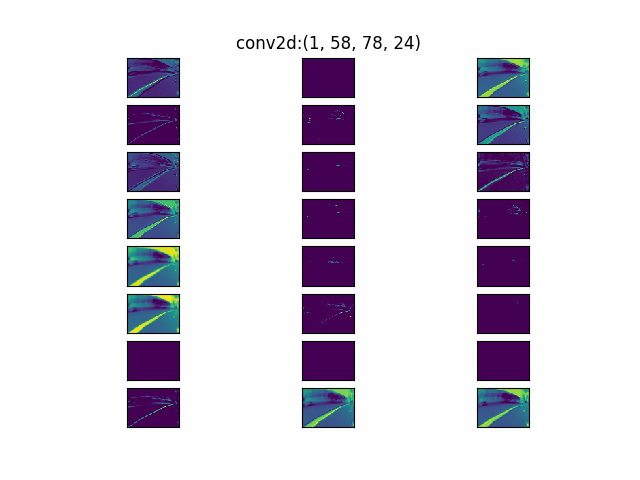
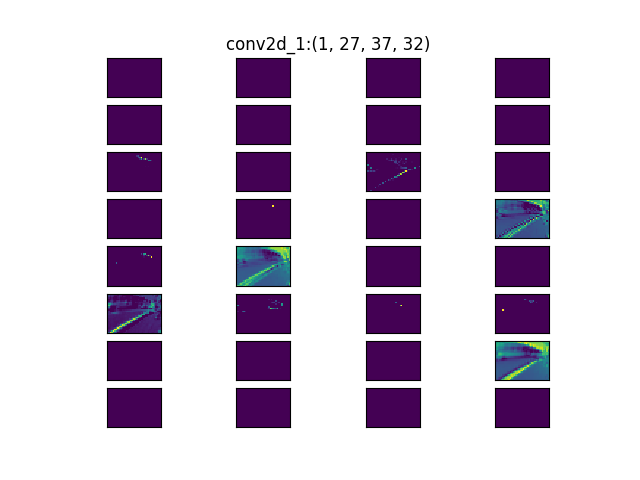
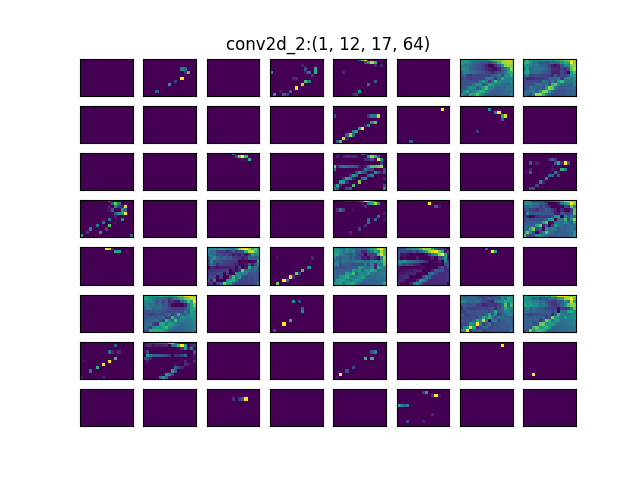
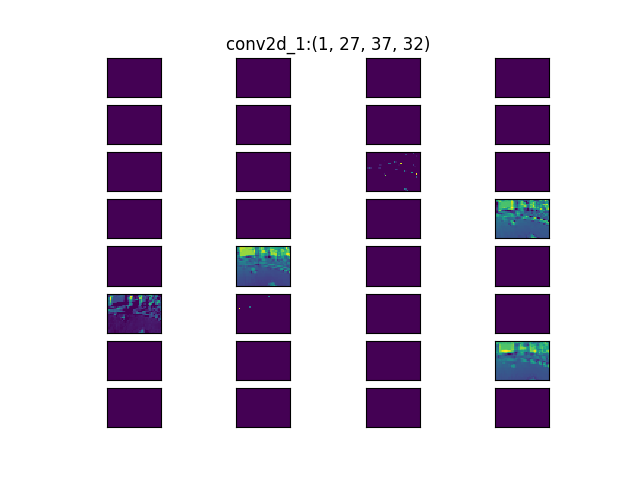
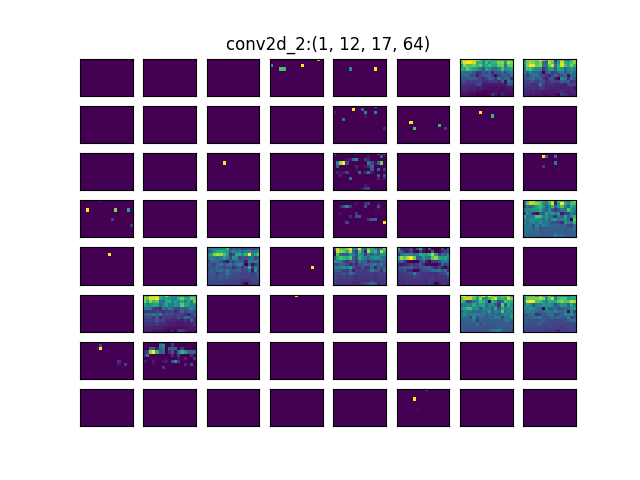
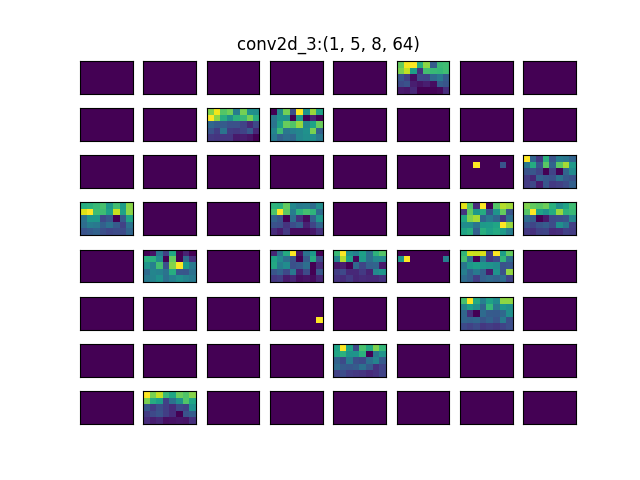
・DonkeyCarで作成した学習モデルの入力に対する各中間層の出力を確認。
・学習モデルは画像のどこに注目しているのか?
-スクリーンが映り込んでいるところは白線が・・・・
→ 自動走行させたとき安定しなかったポイントなので関係あるかもしれない。
(スクリーンの画面が学習時より暗かったなど・・・)
1.直線:右カーブ手前
2.右カーブ:出口
3.直線
4.左カーブ:スクリーンに影響されてる?
自動走行時の動画:スマホで撮影
・2周目、画面左奥のカーブを曲がれていない。
スクリーンを正面に捉えてしまい、そのままスクリーン方向に走っていた?

プログラム
# インポート
import matplotlib.pyplot as plt
import numpy as np
import os

from keras import backend as K
from keras.preprocessing import image
from tensorflow.python.keras.models import Model, load_model
from tensorflow.python.keras.layers import Convolution2D

# モデル読み込み
model_path = 'mypilot'
model = load_model(model_path)

# 画像読み込み
img = image.load_img('423_cam-image_array_.jpg', target_size=(120,160))
x = image.img_to_array(img)
x = np.expand_dims(x, axis=0)
x = x/255
plt.imshow(x[0])
str_pred = "angle_out:"+str(model.predict(x)[0])+",   throttle_out:"+str(model.predict(x)[1])
plt.title('img_in:\n' + str_pred)
plt.show()

# 中間層の特徴量抽出
layers = model.layers[1:6]
layer_outputs = [layer.output for layer in layers]
activation_model = Model(inputs=model.input, outputs=layer_outputs)
activations = activation_model.predict(x)

# 中間層の特徴量可視化
fig1 = plt.figure()
plt.tick_params(labeltop=False, top=False, labelleft=False, left=False, labelbottom=False, bottom=False)
plt.gca().spines['left'].set_visible(False)
plt.gca().spines['right'].set_visible(False)
plt.gca().spines['top'].set_visible(False)
plt.gca().spines['bottom'].set_visible(False)
first_layer_activation = activations[0]
str_shape = str(first_layer_activation.shape)
plt.title('conv2d:'+ str_shape)
print(first_layer_activation.shape)
for i in range(24):
   ax = fig1.add_subplot(8,3,i+1)
   ax.matshow(first_layer_activation[0, :, :, i], cmap='viridis')
   ax.tick_params(labeltop=False, top=False, labelleft=False, left=False, labelbottom=False, bottom=False)
plt.show()

fig1 = plt.figure()
plt.tick_params(labeltop=False, top=False, labelleft=False, left=False, labelbottom=False, bottom=False)
plt.gca().spines['left'].set_visible(False)
plt.gca().spines['right'].set_visible(False)
plt.gca().spines['top'].set_visible(False)
plt.gca().spines['bottom'].set_visible(False)
first_layer_activation = activations[1]
str_shape = str(first_layer_activation.shape)
plt.title('conv2d_1:'+ str_shape)
print(first_layer_activation.shape)
for i in range(32):
   ax = fig1.add_subplot(8,4,i+1)
   ax.matshow(first_layer_activation[0, :, :, i], cmap='viridis')
   ax.tick_params(labeltop=False, top=False, labelleft=False, left=False, labelbottom=False, bottom=False)
plt.show()

fig1 = plt.figure()
plt.tick_params(labeltop=False, top=False, labelleft=False, left=False, labelbottom=False, bottom=False)
plt.gca().spines['left'].set_visible(False)
plt.gca().spines['right'].set_visible(False)
plt.gca().spines['top'].set_visible(False)
plt.gca().spines['bottom'].set_visible(False)
first_layer_activation = activations[2]
str_shape = str(first_layer_activation.shape)
plt.title('conv2d_2:'+ str_shape)
print(first_layer_activation.shape)
for i in range(64):
   ax = fig1.add_subplot(8,8,i+1)
   ax.matshow(first_layer_activation[0, :, :, i], cmap='viridis')
   ax.tick_params(labeltop=False, top=False, labelleft=False, left=False, labelbottom=False, bottom=False)
plt.show()

fig1 = plt.figure()
plt.tick_params(labeltop=False, top=False, labelleft=False, left=False, labelbottom=False, bottom=False)
plt.gca().spines['left'].set_visible(False)
plt.gca().spines['right'].set_visible(False)
plt.gca().spines['top'].set_visible(False)
plt.gca().spines['bottom'].set_visible(False)
first_layer_activation = activations[3]
str_shape = str(first_layer_activation.shape)
plt.title('conv2d_3:'+ str_shape)
print(first_layer_activation.shape)
for i in range(64):
   ax = fig1.add_subplot(8,8,i+1)
   ax.matshow(first_layer_activation[0, :, :, i], cmap='viridis')
   ax.tick_params(labeltop=False, top=False, labelleft=False, left=False, labelbottom=False, bottom=False)
plt.show()

fig1 = plt.figure()
plt.tick_params(labeltop=False, top=False, labelleft=False, left=False, labelbottom=False, bottom=False)
plt.gca().spines['left'].set_visible(False)
plt.gca().spines['right'].set_visible(False)
plt.gca().spines['top'].set_visible(False)
plt.gca().spines['bottom'].set_visible(False)
first_layer_activation = activations[4]
str_shape = str(first_layer_activation.shape)
plt.title('conv2d_4:'+ str_shape)
print(first_layer_activation.shape)
for i in range(64):
   ax = fig1.add_subplot(8,8,i+1)
   ax.matshow(first_layer_activation[0, :, :, i], cmap='viridis')
   ax.tick_params(labeltop=False, top=False, labelleft=False, left=False, labelbottom=False, bottom=False)
plt.show()
参考図書
・RとKerasによるディープラーニング
https://www.oreilly.co.jp/books/9784873118574/
テンソルの構造やDnkeycarのソースコードを読み解いたり、CNNの可視化方法を考えるのに参考になった。


