目的
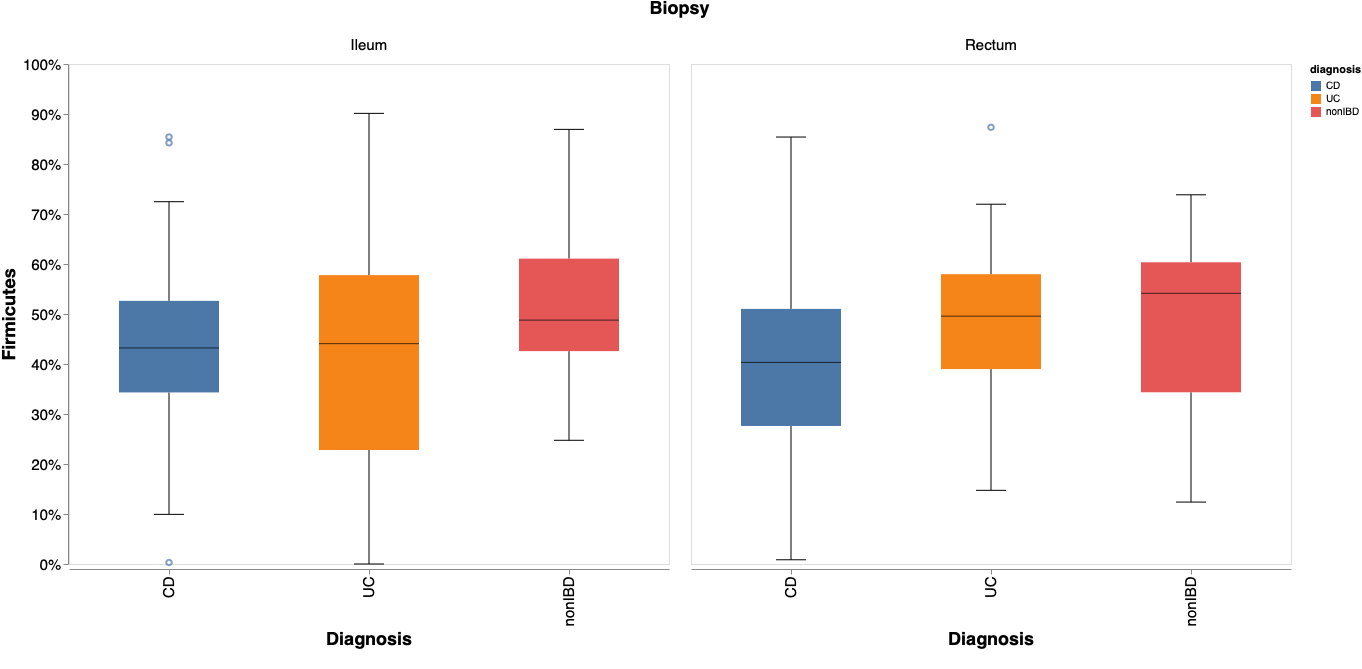
Qiime2を用いた 16S rRNA 菌叢解析の結果から、特定の細菌の構成率の分布を可視化する方法を紹介する。前項では CD (クローン病) 群、UC (潰瘍性大腸炎) 群、nonIBD 群 (非炎症性腸疾患)群の腸内細菌叢を比較したが、本稿では $Fimicutes$ 門の構成率の分布を箱ひげ図で表す方法を紹介する。本稿を参考にすると、以下のような箱ひげ図を作成できるようになる。
環境
- MacBook Air (Retina, 13-inch, 2018)
- macOS Catalina (version 10.15.6)
- Python 3.8.4
パッケージ
今回は、Python の DataFrame を入力することで様々なグラフを作成できる Altairを用いる。箱ひげ図以外の描画についてはこちらでも紹介している。
データについて
箱ひげ図の作成には、サンプルごとに細菌の read 数がまとめられたカウントデータと、サンプルのメタデータが必要である。詳しくは前項を参考にするとよい。
カウントデータの取得
カウントデータの取得には、table.qza と taxonomy.qza が必要である。各ファイルの作成方法は、こちらを参考にするとよい。本稿では、Phylum (門)レベルのカウントデータを用いるため、--p-level 2 に注意して以下のコマンドを実行する。
qiime taxa collapse   --i-table table.qza   --i-taxonomy taxonomy.qza   --p-level 2   --o-collapsed-table L2_table.qza

qiime tools export  --input-path L2_table.qza   --output-path L2

biom convert  -i L2/feature-table.biom  -o L2/table.tsv  --to-tsv
以下のようなファイルが得られれば成功である。
メタデータの取得
以下のようなメタデータを tsv 形式で作成する。
Altair の実行
以下のコマンドを実行すると箱ひげ図が得られる。
import os
import altair as alt
import pandas as pd

# 分類階級の指定。Phylum は level 2 である。
l_select = 'L2'

# カレントディレクトリ取得
cwd = os.getcwd()

# カウントデータの取得
count_path = [l_select,'table.tsv']
count_file = os.path.join(cwd, *count_path)
count = pd.read_table(count_file, sep='\t', index_col=0 ,header=1).T # header=1に注意

# 組成データに変換
comp = count.apply(lambda x: x/sum(x), axis=1)

# メタデータの取得
md_path = ['metadata.tsv']
md_file = os.path.join(cwd, *md_path)
md = pd.read_table(md_file, sep='\t', index_col=0 ,header=0)

# 行名を str 型に変換(今回の行名は数字のため int型で処理されてしまっている)
comp.index = comp.index.astype(str)
md.index = md.index.astype(str)

# カウントデータとメタデータを結合。(行名が str 型でなければ結合しない)
df = pd.concat([comp,md], axis=1)

# 今回は Ileum (回腸)と Rectum (直腸)の菌叢を調べる。(他の部位はサンプル数が少なかったため)
df = df[df['biopsy_location'].isin(['Ileum','Rectum'])]

# Altair の実行
boxplot = alt.Chart(df).mark_boxplot(size=100,ticks=alt.MarkConfig(width=30), median=alt.MarkConfig(color='black',size=100)).encode(
	    alt.X('diagnosis',sort = alt.Sort(['CD','UC','nonIBD']), axis=alt.Axis(labelFontSize=15, ticks=True, titleFontSize=18, title='Diagnosis')),
	    alt.Y('D_0__Bacteria;D_1__Firmicutes', axis=alt.Axis(format='%', labelFontSize=15, ticks=True, titleFontSize=18, grid=False,domain=True, title='Firmicutes'), scale=alt.Scale(domain=[0,0.02])),
	    alt.Color('diagnosis'),
	    alt.Column('biopsy_location', header=alt.Header(labelFontSize=15, titleFontSize=18), sort = alt.Sort(['Ileum','Rectum']), title='Biopsy')
	).properties(
		width=600,
		height=500,
	)

# 図の表示
boxplot.show()
Altair について
Altair のコマンドについて簡単に紹介する。
-
alt.Chart(df)可視化する DataFrame を入力する。 -
.mark_boxplot()箱ひげ図の設定をする。-
size箱の幅 -
ticks髭の設定 -
median中央値に入る線の設定
-
-
.encode()DataFrame の中身に依存する設定-
alt.X()X軸成分を決める列を指定する-
alt.Sort()軸の順番を決める -
alt.Axis()軸の設定。titleで DataFrame と違う文字を入力することも可能。ticks=Falseで軸上の線が消える。
-
-
alt.Y()Y軸成分を決める列を指定する-
alt.Axis()軸の設定。format='%'でパーセント表示にできる。grid=Falseでグラフ上の横線を消している。
-
-
alt.Color()色を決める列を指定する。 -
alt.Column()グラフを並行に並べる。
-
-
property()DataFrame の中身に依存しない設定。ここでは図の大きさを指定している。
図の保存
右上の「・・・」から png 形式または svg 形式で図を保存できる。


