R言語 Advent Calendar 2024の22日目の記事です。
背景
春からコーギーの仔犬と暮らし始めて、朝晩お散歩の日々です。散歩をする上で気になるのが天気です。雨だと単純に大変ですし、地表面の近くを歩く犬にとって高温・暑熱は大敵です。本記事では快適な犬ライフに向けて散歩に好適な気象条件の地域差を解析します。
準備
散歩好適を判断する具体的な条件として、ここでは以下のようなものを採用します。
- 高温条件: 気温が30 °C以上ならば不適
- 暑熱条件: 熱中症リスクを反映する湿球黒球温度 (WBGT) が25 °C以上ならば不適
- 降雨条件: 1時間降水量が0.1 mmより大きければ不適、ただし気温が0 °C以下ならば好適 (雨ではなく雪が降る)
- 低温条件: 気温が-10 °C以下ならば不適
これらの4つの制約条件のいずれにも該当しない場合を散歩好適とみなします。WBGTは文献1に従って以下の式で算出されています。
$$WBGT = 0.735 \times T_a + 0.0374 \times RH + 0.00292 \times T_a \times RH + 7.619 \times SR - 4.557 \times SR^2 - 0.0572 \times WS - 4.064$$
ここで、$T_a$は気温 (°C)、$RH$は相対湿度 (%)、$SR$は全天日射量 (kW m-2)、$WS$は平均風速 (m s-1) です。
解析に利用した気象データはNASAのThe POWER Project2が提供する時別値データです。空間解像度は日射関連要素で1° x 1°、その他気象要素で0.5° x 0.625° (緯度 x 経度) なので、50–100 kmほどのイメージです。以下の関数は、期間・地点・気象要素を指定することで、APIを経由して時別気象データを取得します。
fetch_nasapower <-
function(start, end, lat, lon, parameters = c("T2M", "RH2M", "WS2M", "PRECTOTCORR", "ALLSKY_SFC_SW_DWN"), file = NULL, .silent = TRUE){
param <- stringr::str_c(parameters, collapse = "%2C")
url <- stringr::str_glue("https://power.larc.nasa.gov/api/temporal/hourly/point?start={start}&end={end}&latitude={lat}&longitude={lon}&community=ag¶meters={param}&format=csv&header={!is.null(file)}&time-standard=lst")
if(is.null(file)){
file <- tempfile()
download.file(url, destfile = file, quiet = .silent)
data <- readr::read_csv(file, col_types = readr::cols())
} else {
download.file(url, destfile = file, quiet = .silent)
# solar radiation系のパラメータを含む場合はskip = 11, 含まない場合はskip = 10になるらしい
data <- readr::read_csv(file, col_types = readr::cols(), skip = 11)
}
data |>
dplyr::mutate(time = lubridate::ymd_hm(paste0(YEAR, "-", MO, "-", DY, " ", HR, ":00")), .before = 1,
lat, lon) |>
dplyr::select(-YEAR, -MO, -DY, -HR)
}
関数の挙動は以下の通りです。T2M、RH2M、WS2Mはそれぞれ地上2 m高度における気温 (°C)、相対湿度 (%)、風速 (m s-1)、PRECTOTCORRは降水量 (mm h-1)、ALLSKY_SFC_SW_DWNは全天日射量 (MJ m-2 h-1) です。データ生成が未完了な直近数ヶ月には-999が無効値として入っています。
sample_data <- fetch_nasapower(start = 20210101, end = 20241219, lat = 43, lon = 141.4)

sample_data
# # A tibble: 34,776 × 8
#    time                  lat   lon   T2M PRECTOTCORR ALLSKY_SFC_SW_DWN  RH2M  WS2M
#    <dttm>              <dbl> <dbl> <dbl>       <dbl>             <dbl> <dbl> <dbl>
#  1 2021-01-01 00:00:00    43  141. -13.2        0.28              0     98.5  2.07
#  2 2021-01-01 01:00:00    43  141. -13.1        0.29              0     98.5  2.24
#  3 2021-01-01 02:00:00    43  141. -13.0        0.38              0     98.2  2.45
#  4 2021-01-01 03:00:00    43  141. -12.9        0.39              0     97.8  2.6
#  5 2021-01-01 04:00:00    43  141. -12.9        0.37              0     97.6  2.6
#  6 2021-01-01 05:00:00    43  141. -12.9        0.38              0     97.6  2.54
#  7 2021-01-01 06:00:00    43  141. -13.1        0.42              0     97.9  2.46
#  8 2021-01-01 07:00:00    43  141. -13.3        0.45              0.06  98.2  2.37
#  9 2021-01-01 08:00:00    43  141. -13.1        0.45              0.11  97.5  2.44
# 10 2021-01-01 09:00:00    43  141. -12.4        0.3               0.22  95.6  2.92
# # ℹ 34,766 more rows
# # ℹ Use `print(n = ...)` to see more rows

skimr::skim(sample_data)
# ── Data Summary ────────────────────────
#                            Values
# Name                       sample_data
# Number of rows             34776
# Number of columns          8
# _______________________
# Column type frequency:
#   numeric                  7
#   POSIXct                  1
# ________________________
# Group variables            None
#
# ── Variable type: numeric ─────────────────────────────────────────────────────────────────────────────────────
#   skim_variable     n_missing complete_rate     mean    sd    p0    p25    p50    p75   p100 hist
# 1 lat                       0             1   43       0     43   43     43     43     43    ▁▁▇▁▁
# 2 lon                       0             1  141.      0    141. 141.   141.   141.   141.   ▁▁▇▁▁
# 3 T2M                       0             1    0.581  82.4 -999   -2.08   7.44  16.4   31.9  ▁▁▁▁▇
# 4 PRECTOTCORR               0             1   -6.48   81.2 -999    0      0.02   0.12  18.7  ▁▁▁▁▇
# 5 ALLSKY_SFC_SW_DWN         0             1 -117.    322.  -999    0      0      0.69   3.53 ▁▁▁▁▇
# 6 RH2M                      0             1   80.2    89.1 -999   81.4   92.3   96.5  100    ▁▁▁▁▇
# 7 WS2M                      0             1   -4.98   81.3 -999    0.92   1.36   2.12  11.1  ▁▁▁▁▇
#
# ── Variable type: POSIXct ─────────────────────────────────────────────────────────────────────────────────────
#   skim_variable n_missing complete_rate min                 max                 median              n_unique
# 1 time                  0             1 2021-01-01 00:00:00 2024-12-19 23:00:00 2022-12-26 11:30:00    34776
後の処理のため、列名変更、データ生成未完了な行の除外、WBGTの計算までを行う下処理用の関数を準備します。
prep_nasapower <-
  function(nasapower){
    nasapower |>
      dplyr::rename(temp = T2M, rh = RH2M, rain = PRECTOTCORR, rad = ALLSKY_SFC_SW_DWN, wind = WS2M) |>
      dplyr::filter(rad != -999) |>
      dplyr::mutate(
        hour = lubridate::hour(time), date = lubridate::date(time),
        rad = rad / 3600 * 10^3, # MJ m-2 h-1 -> kW m-2
        WBGT = 0.735*temp + 0.0374*rh + 0.00292*temp*rh + 7.619*rad - 4.557*rad^2 - 0.0572*wind - 4.064
      )
  }

sample_clean <- prep_nasapower(sample_data)
sample_clean
# # A tibble: 30,681 × 11
#    time                  lat   lon  temp  rain    rad    rh  wind  hour date        WBGT
#    <dttm>              <dbl> <dbl> <dbl> <dbl>  <dbl> <dbl> <dbl> <int> <date>     <dbl>
#  1 2021-01-01 00:00:00    43  141. -13.2  0.28 0       98.5  2.07     0 2021-01-01 -14.0
#  2 2021-01-01 01:00:00    43  141. -13.1  0.29 0       98.5  2.24     1 2021-01-01 -13.9
#  3 2021-01-01 02:00:00    43  141. -13.0  0.38 0       98.2  2.45     2 2021-01-01 -13.8
#  4 2021-01-01 03:00:00    43  141. -12.9  0.39 0       97.8  2.6      3 2021-01-01 -13.7
#  5 2021-01-01 04:00:00    43  141. -12.9  0.37 0       97.6  2.6      4 2021-01-01 -13.7
#  6 2021-01-01 05:00:00    43  141. -12.9  0.38 0       97.6  2.54     5 2021-01-01 -13.8
#  7 2021-01-01 06:00:00    43  141. -13.1  0.42 0       97.9  2.46     6 2021-01-01 -13.9
#  8 2021-01-01 07:00:00    43  141. -13.3  0.45 0.0167  98.2  2.37     7 2021-01-01 -14.0
#  9 2021-01-01 08:00:00    43  141. -13.1  0.45 0.0306  97.5  2.44     8 2021-01-01 -13.7
# 10 2021-01-01 09:00:00    43  141. -12.4  0.3  0.0611  95.6  2.92     9 2021-01-01 -12.8
# # ℹ 30,671 more rows
# # ℹ Use `print(n = ...)` to see more rows

arrow::write_parquet(sample_clean, "sample_clean.parquet")
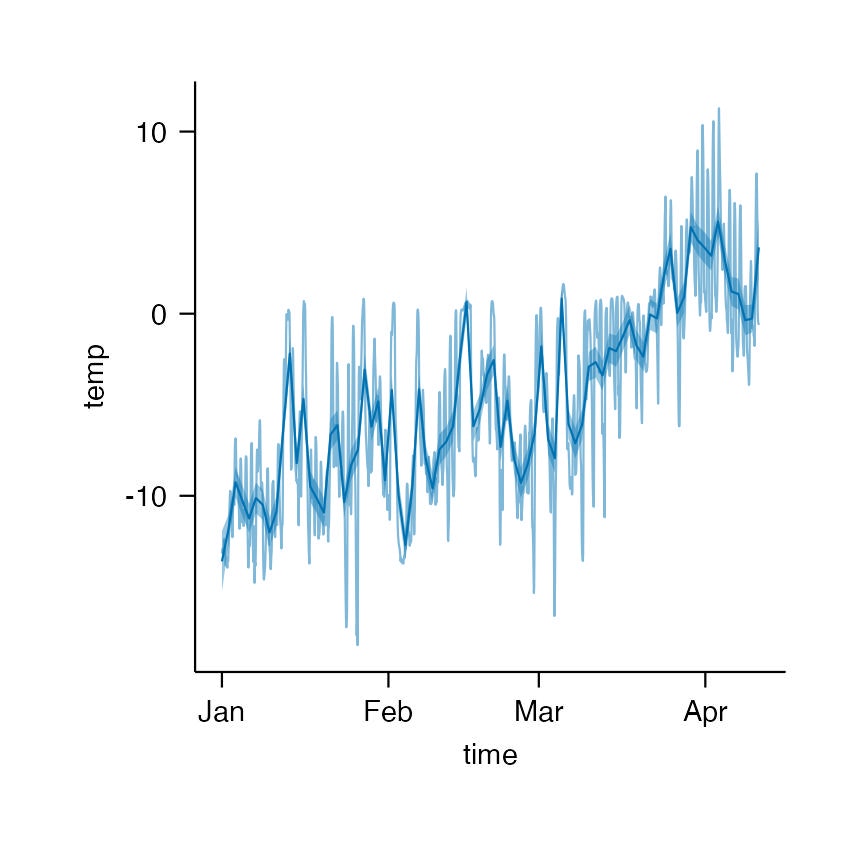
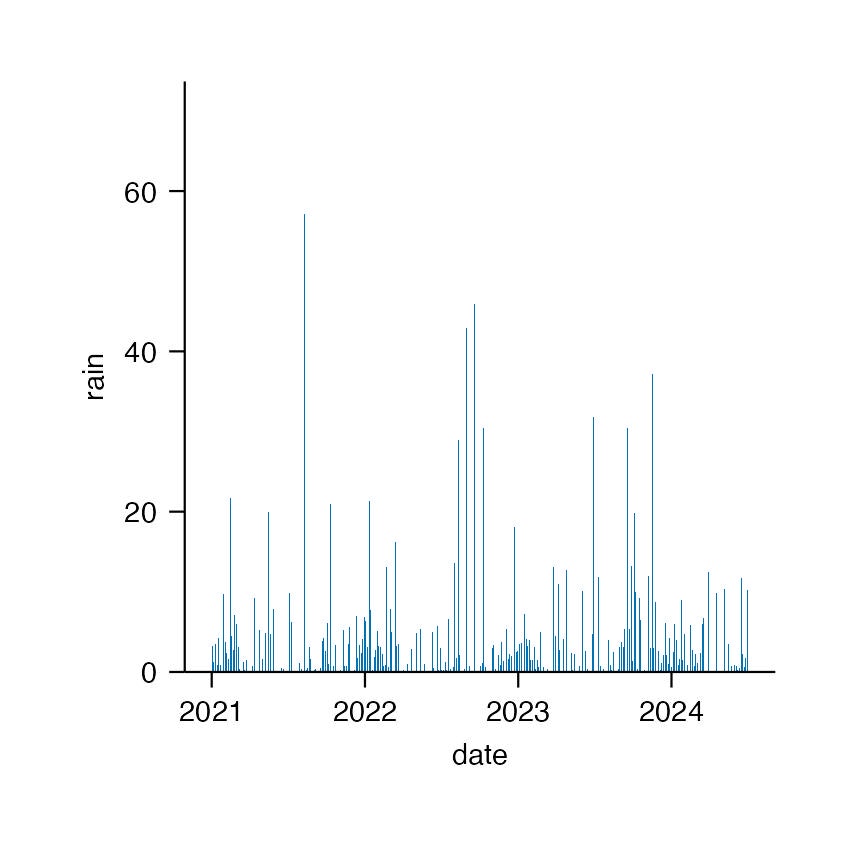
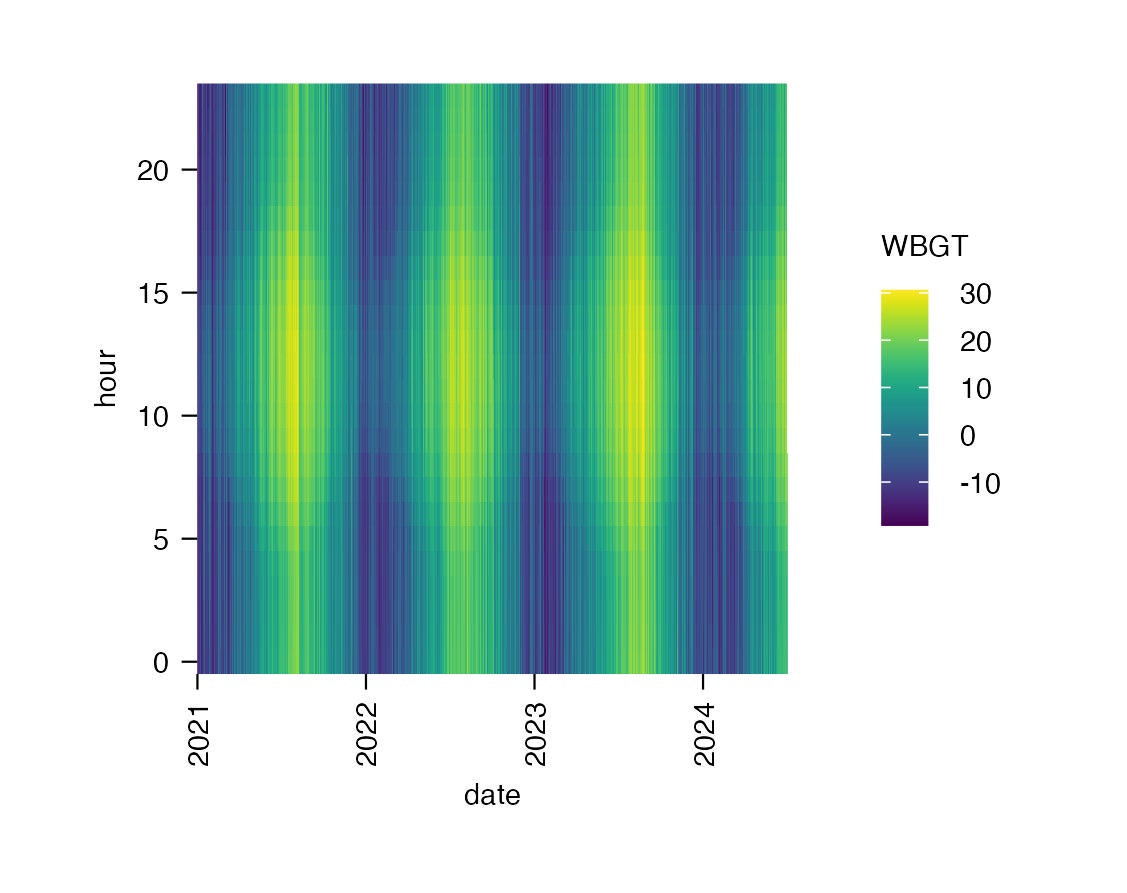
データを可視化して概観します。お試しと練習を兼ねて話題のtidyplotsを使います。今回のアドカレでも2日目の記事にまとめられています。気象データ関連ではとくに時差ズレが怖いところですが、このAPIは地点データ取得の場合にはローカルタイムになるよう調整されているようです。
library(tidyplots)

sample_clean <- arrow::read_parquet("sample_clean.parquet")

sample_clean |>
  head(24 * 100) |>
  tidyplot(x = time, y = temp) |>
  add_line(alpha = .5) |>
  add_curve_fit(span = 1/24)
sample_clean |>
  tidyplot(x = date, y = rain) |>
  add_sum_bar()
sample_clean |>
  tidyplot(x = date, y = hour, color = WBGT) |>
  add_heatmap()
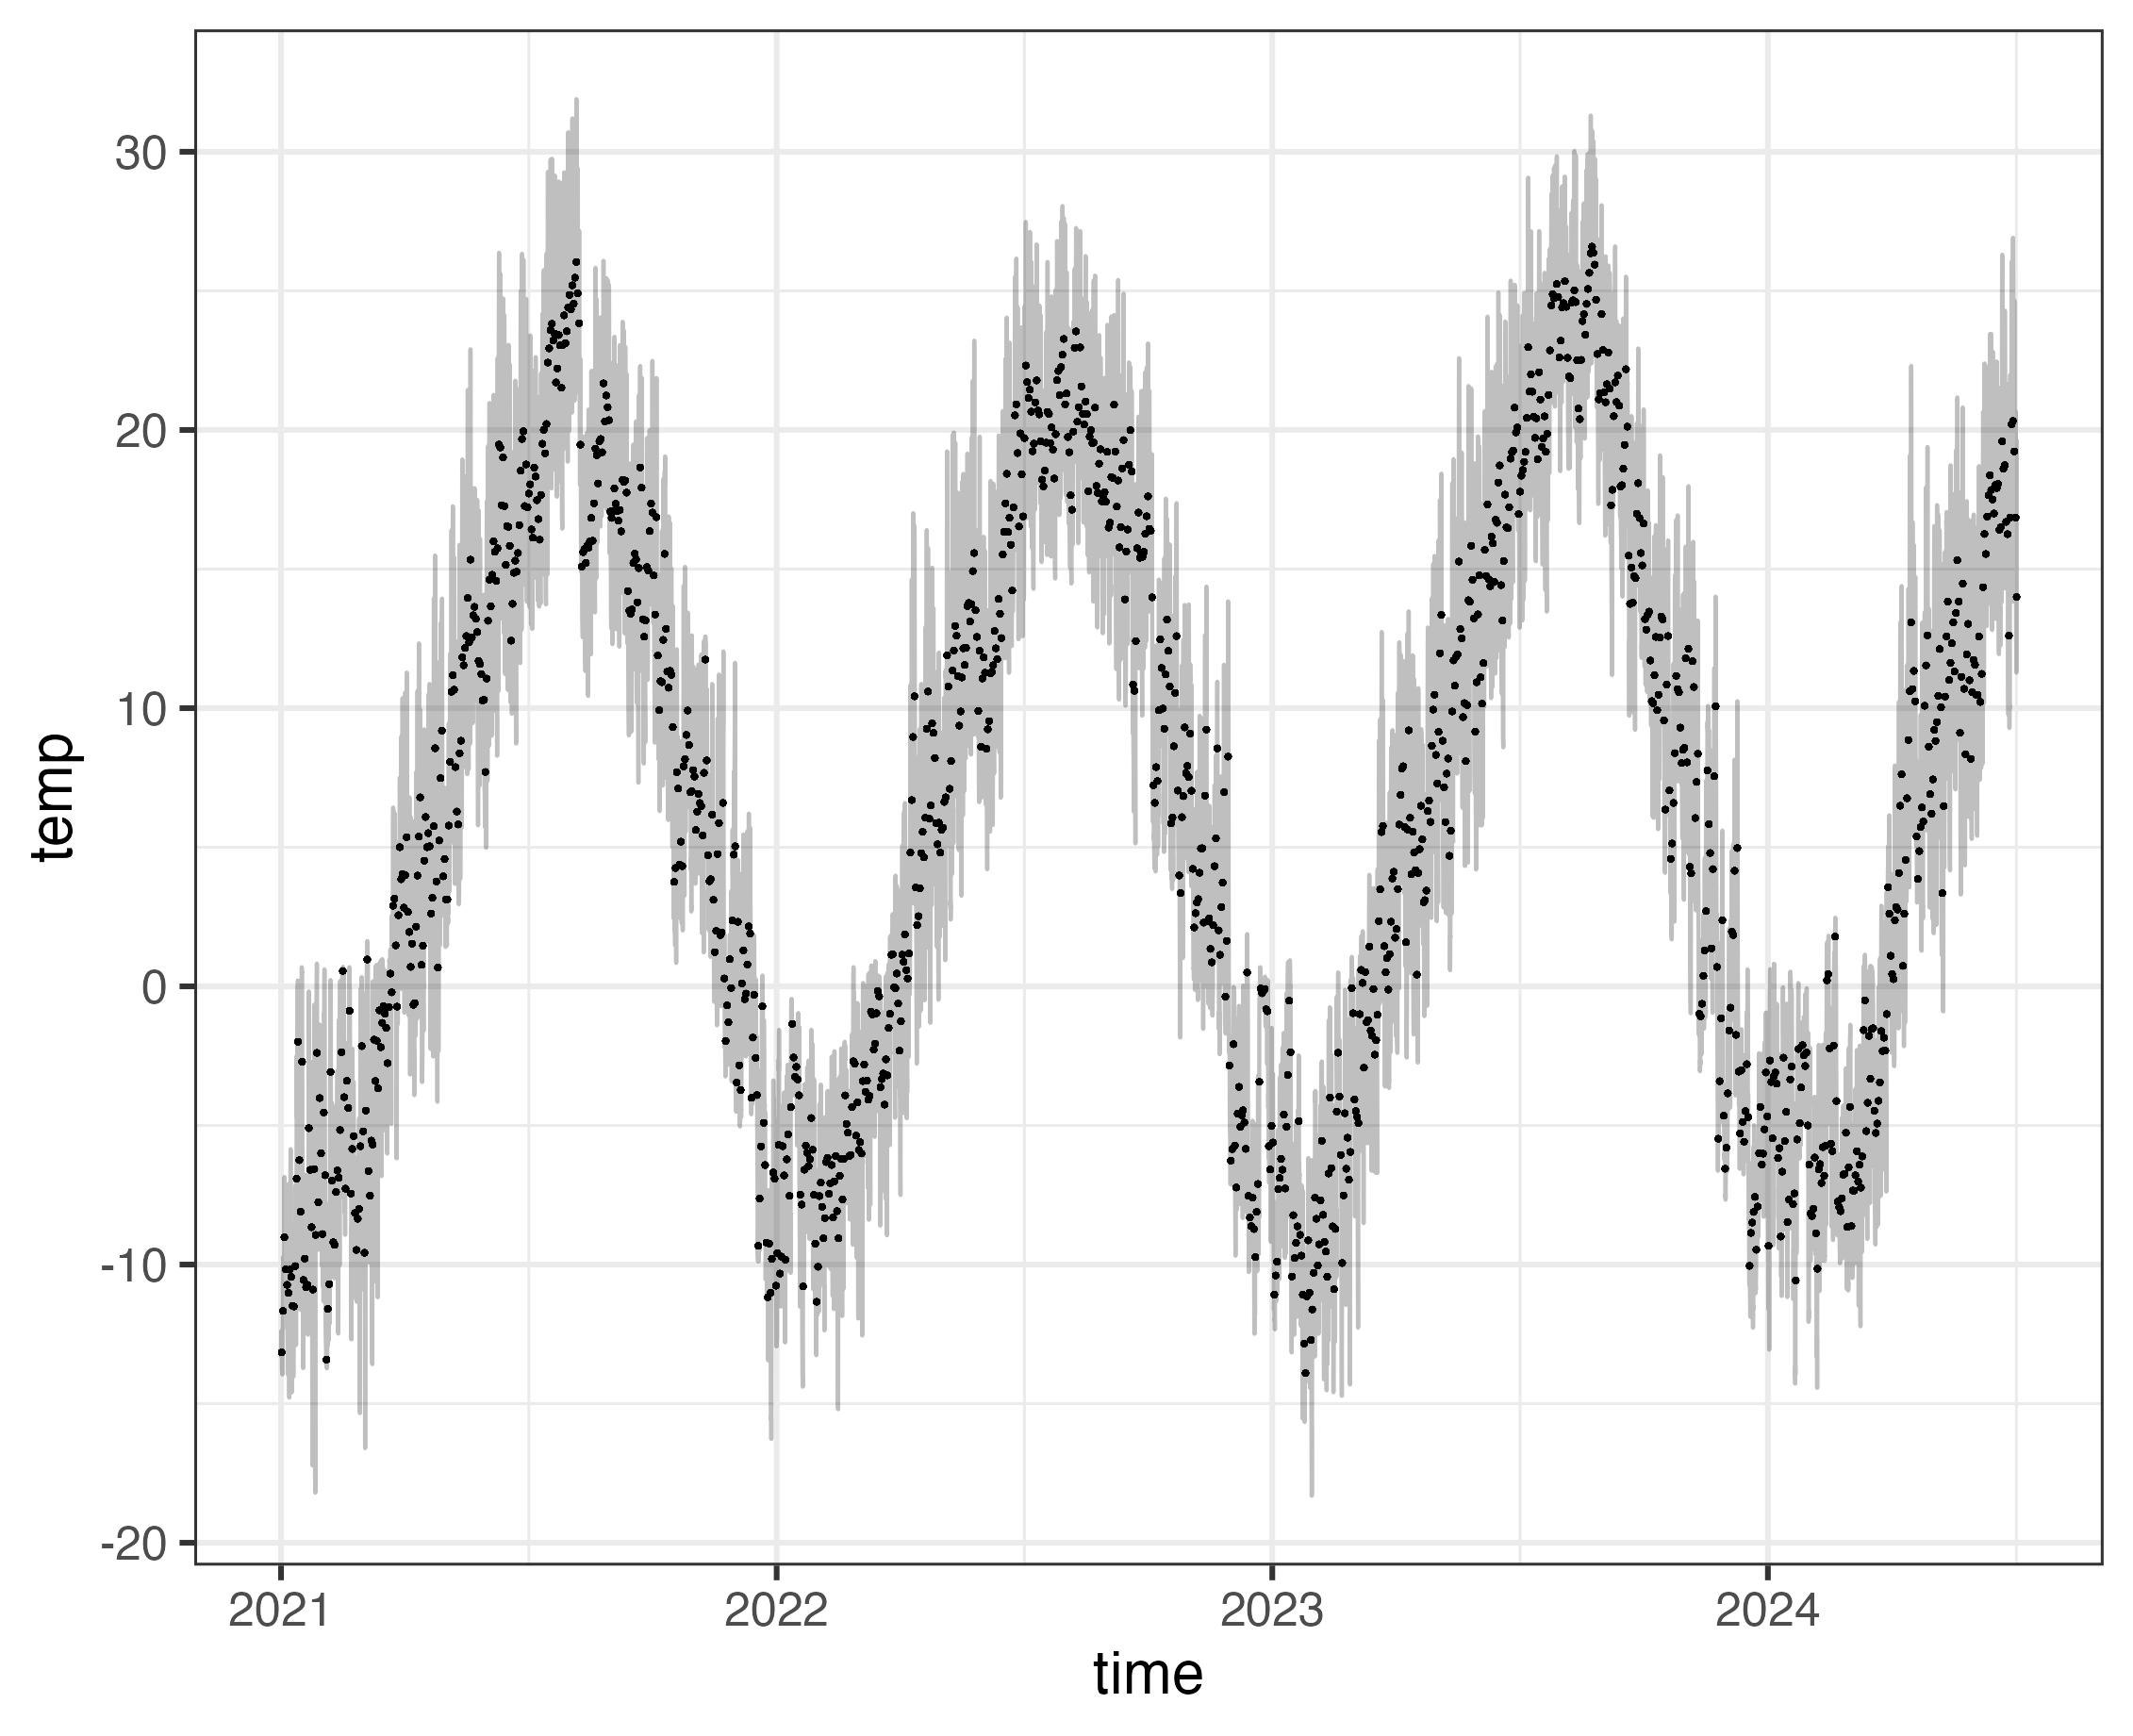
tidyplotsは生データを渡して統計量を表示するには便利です。ggplot2だと一度統計量を計算したものを別オブジェクトに保存して...みたいなことをしがちなので。ただし、ぱっとみた限りggplot2のようにlayerごとにx軸のマッピングを変えるみたいなことができないのがちょっと不便かも?下図のように日平均気温と時別気温で異なるx軸を使うプロット、とか。
library(ggplot2)

sample_clean |>
  dplyr::group_by(date) |>
  dplyr::mutate(mean_temp = mean(temp),
                mean_time = mean(time)) |>
  ggplot(aes(x = time, y = temp)) +
  geom_line(alpha = .25) +
  geom_point(data = dplyr::distinct_all, aes(x = mean_time, y = mean_temp), size = .2)
横道にそれましたが、気象データの扱いに問題はなさそうです。最後に散歩好適条件を判定する関数を作成します。
judge_sampo <-
  function(df){
    df |>
      dplyr::transmute(
        date, hour, lat, lon,
        pass_A = temp < 30,
        pass_B = WBGT < 25,
        pass_C = rain <= 0.1 | temp <= 0,
        pass_D = temp > -10,
        pass_all = (pass_A + pass_B + pass_C + pass_D) == 4
      )
  }

judge_sampo(sample_clean)
# A tibble: 30,681 × 9
   date        hour   lat   lon pass_A pass_B pass_C pass_D pass_all
   <date>     <int> <dbl> <dbl> <lgl>  <lgl>  <lgl>  <lgl>  <lgl>
 1 2021-01-01     0    43  141. TRUE   TRUE   TRUE   FALSE  FALSE
 2 2021-01-01     1    43  141. TRUE   TRUE   TRUE   FALSE  FALSE
 3 2021-01-01     2    43  141. TRUE   TRUE   TRUE   FALSE  FALSE
 4 2021-01-01     3    43  141. TRUE   TRUE   TRUE   FALSE  FALSE
 5 2021-01-01     4    43  141. TRUE   TRUE   TRUE   FALSE  FALSE
 6 2021-01-01     5    43  141. TRUE   TRUE   TRUE   FALSE  FALSE
 7 2021-01-01     6    43  141. TRUE   TRUE   TRUE   FALSE  FALSE
 8 2021-01-01     7    43  141. TRUE   TRUE   TRUE   FALSE  FALSE
 9 2021-01-01     8    43  141. TRUE   TRUE   TRUE   FALSE  FALSE
10 2021-01-01     9    43  141. TRUE   TRUE   TRUE   FALSE  FALSE
# ℹ 30,671 more rows
以上で、気象データの取得からデータの下処理、散歩好適判定までを行う一連のパイプラインができました。
解析 | 国内地点比較
札幌・東京・京都・福岡で散歩好適判定を行ってみます。以降は使い慣れたggplot2を使います。
compare_jpn <-
  list(`札幌` = list(lat = 43.0, lon = 141.4),
       `東京` = list(lat = 35.7, lon = 139.7),
       `京都` = list(lat = 34.7, lon = 135.5),
       `福岡` = list(lat = 33.5, lon = 130.4)) |>
    purrr::map_dfr(.id = "region", function(site){
      fetch_nasapower(start = 20190101, end = 20231231, lat = site$lat, lon = site$lon) |>
        prep_nasapower() |>
        judge_sampo()
    })

compare_jpn
# # A tibble: 175,296 × 10
#    region date        hour   lat   lon pass_A pass_B pass_C pass_D pass_all
#    <chr>  <date>     <int> <dbl> <dbl> <lgl>  <lgl>  <lgl>  <lgl>  <lgl>
#  1 札幌   2019-01-01     0    43  141. TRUE   TRUE   TRUE   TRUE   TRUE
#  2 札幌   2019-01-01     1    43  141. TRUE   TRUE   TRUE   TRUE   TRUE
#  3 札幌   2019-01-01     2    43  141. TRUE   TRUE   TRUE   TRUE   TRUE
#  4 札幌   2019-01-01     3    43  141. TRUE   TRUE   TRUE   TRUE   TRUE
#  5 札幌   2019-01-01     4    43  141. TRUE   TRUE   TRUE   TRUE   TRUE
#  6 札幌   2019-01-01     5    43  141. TRUE   TRUE   TRUE   TRUE   TRUE
#  7 札幌   2019-01-01     6    43  141. TRUE   TRUE   TRUE   TRUE   TRUE
#  8 札幌   2019-01-01     7    43  141. TRUE   TRUE   TRUE   TRUE   TRUE
#  9 札幌   2019-01-01     8    43  141. TRUE   TRUE   TRUE   TRUE   TRUE
# 10 札幌   2019-01-01     9    43  141. TRUE   TRUE   TRUE   TRUE   TRUE
# # ℹ 175,286 more rows
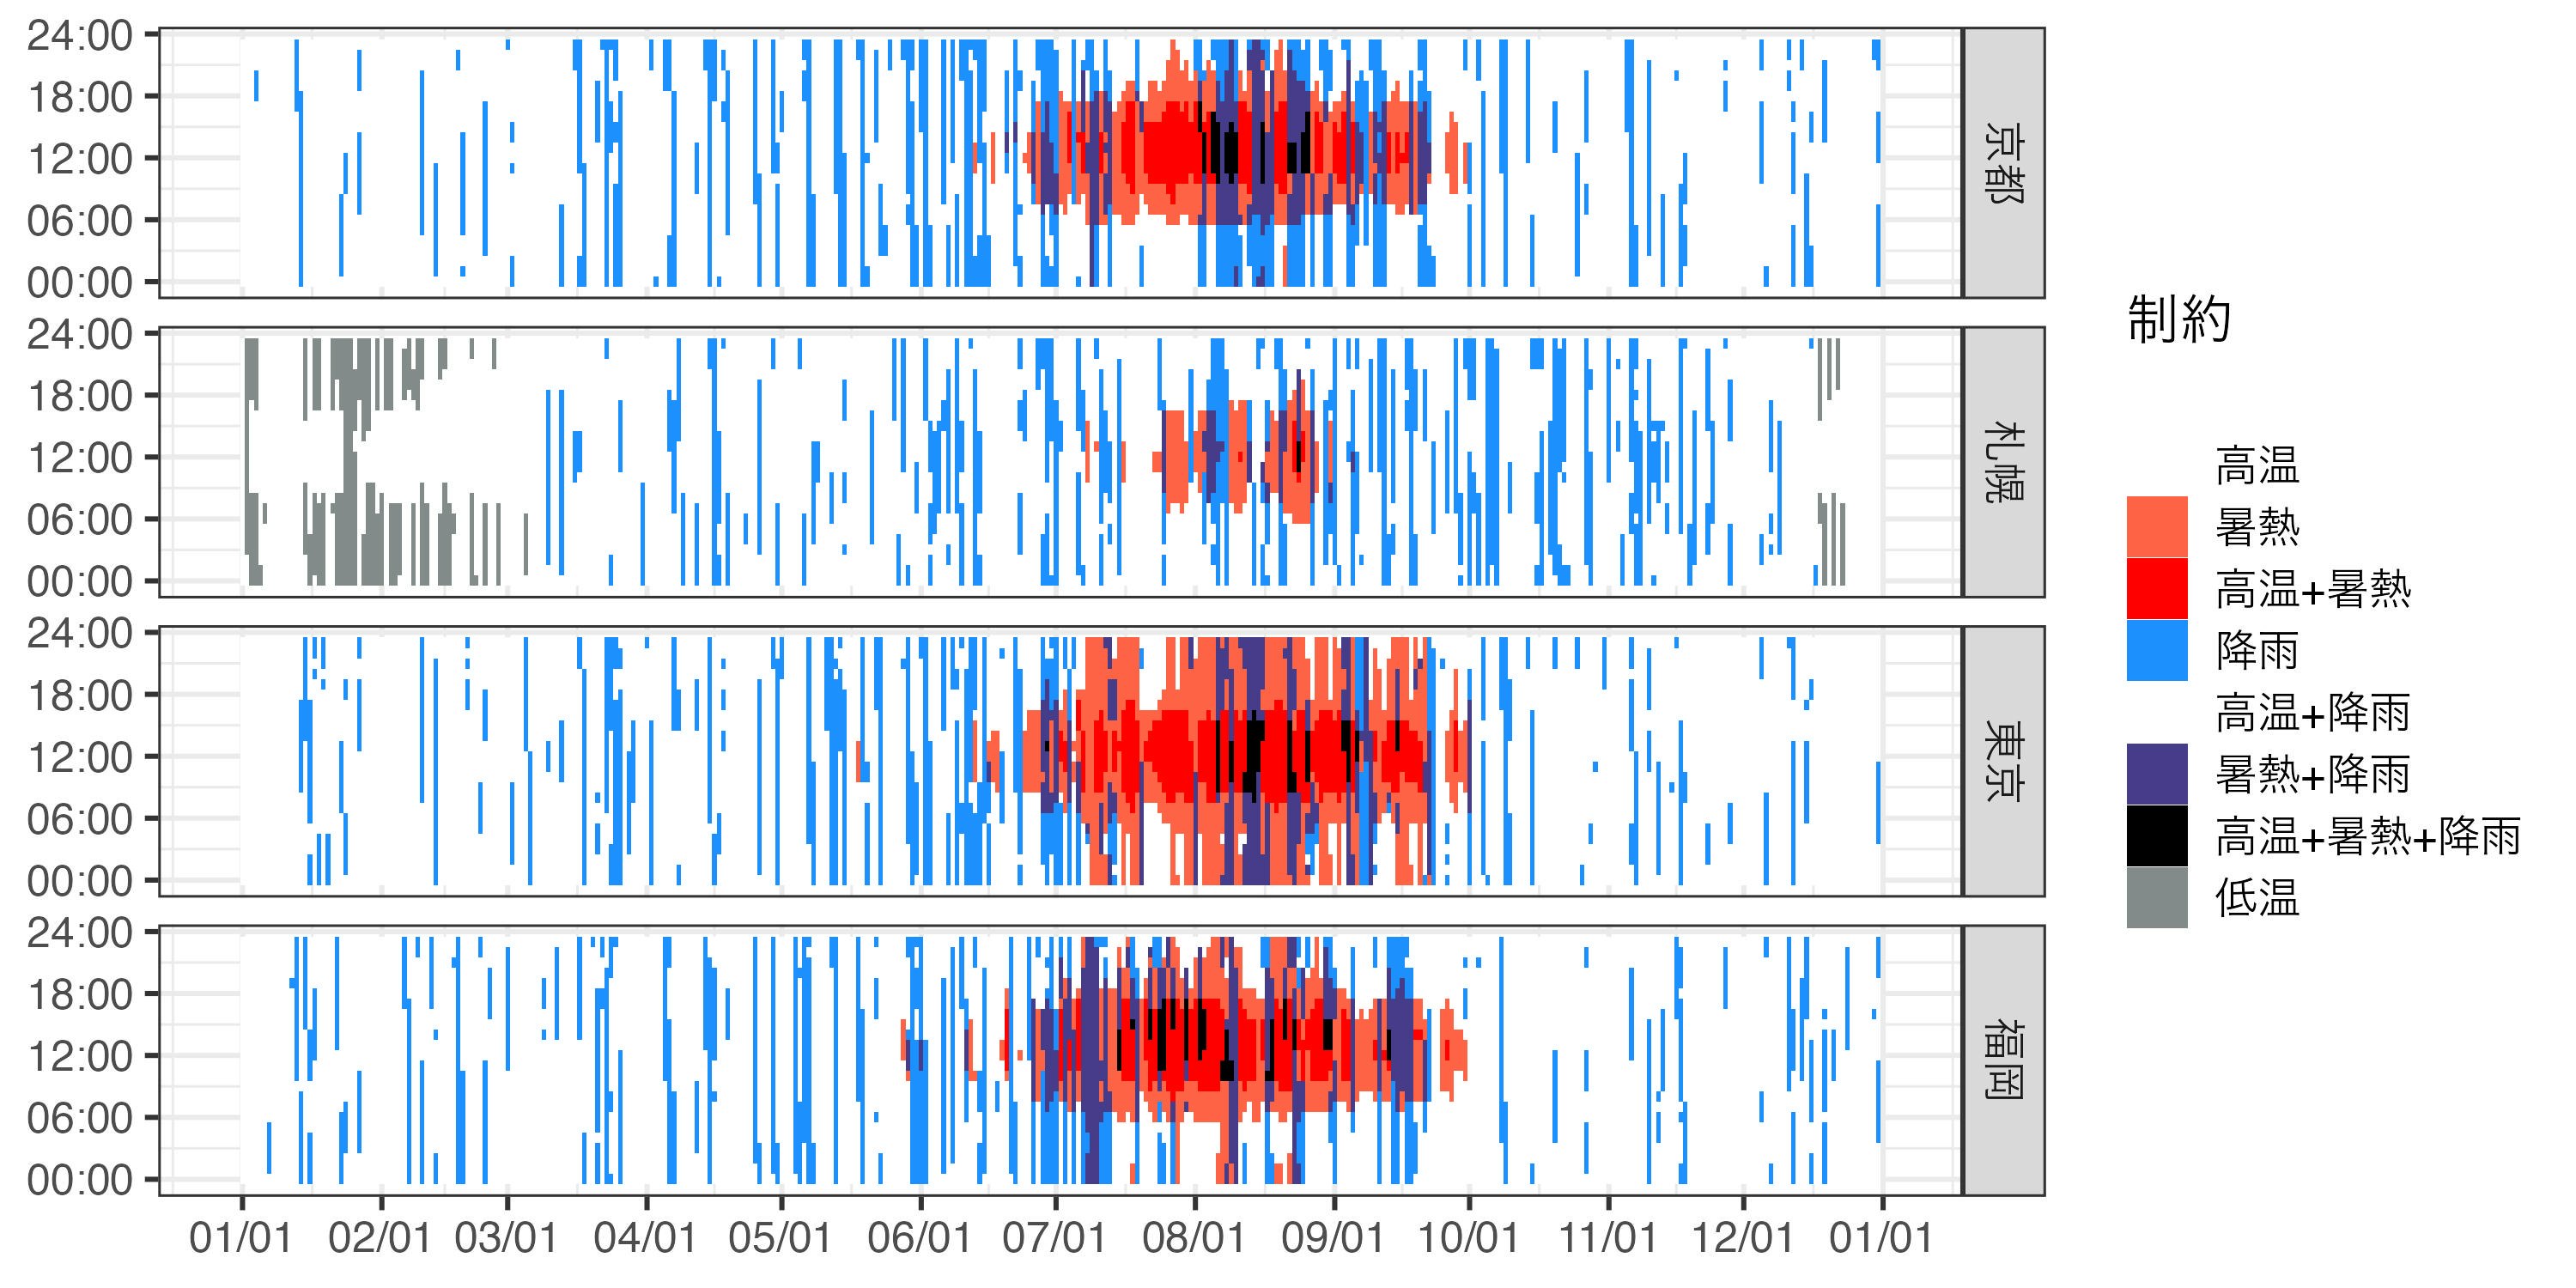
2023年の日・時刻ごとに散歩を制約した要因を可視化します。(今年もそうでしたが) 去年は猛暑だったので、本州では7月から9月にかけてほぼ毎日日中から夕方まで散歩不適という判定になりました。札幌でも真夏には高温による制約が起こっています。実際の散歩中の様子を踏まえると、高温・暑熱由来の不適判定はもう少し発生しやすくしてもいい印象です。また、日本は降水量が多いので、高温に加えて雨による制約もかかる場合が散見され、とくに夏季に制約が多い傾向にあります。
compare_jpn |>
  dplyr::filter(lubridate::year(date) == 2023) |>
  dplyr::mutate(limitation = paste0(dplyr::if_else(pass_A, "", "A"),
                                    dplyr::if_else(pass_B, "", "B"),
                                    dplyr::if_else(pass_C, "", "C"),
                                    dplyr::if_else(pass_D, "", "D")),
                limitation = factor(limitation,
                                    levels = c("", "A", "B", "AB", "C", "AC", "BC", "ABC", "D"),
                                    labels = c("", "高温", "暑熱", "高温+暑熱", "降雨", "高温+降雨", "暑熱+降雨", "高温+暑熱+降雨", "低温")
                                    )) |>
  ggplot(aes(date, hour, fill = limitation)) +
  geom_tile() +
  facet_grid(region ~ .) +
  scale_x_date(date_breaks = "1 month", date_labels = "%m/%d") +
  scale_y_continuous(breaks = seq(0, 24, by = 6), labels = c("00:00", "06:00", "12:00", "18:00", "24:00")) +
  scale_fill_manual(values = c("white", "orange", "tomato", "red", "dodgerblue", "slateblue2", "slateblue4", "black", "azure4"),
                    limits = c("", "高温", "暑熱", "高温+暑熱", "降雨", "高温+降雨", "暑熱+降雨", "高温+暑熱+降雨", "低温")) +
  labs(x = NULL, y = NULL, fill = "制約")
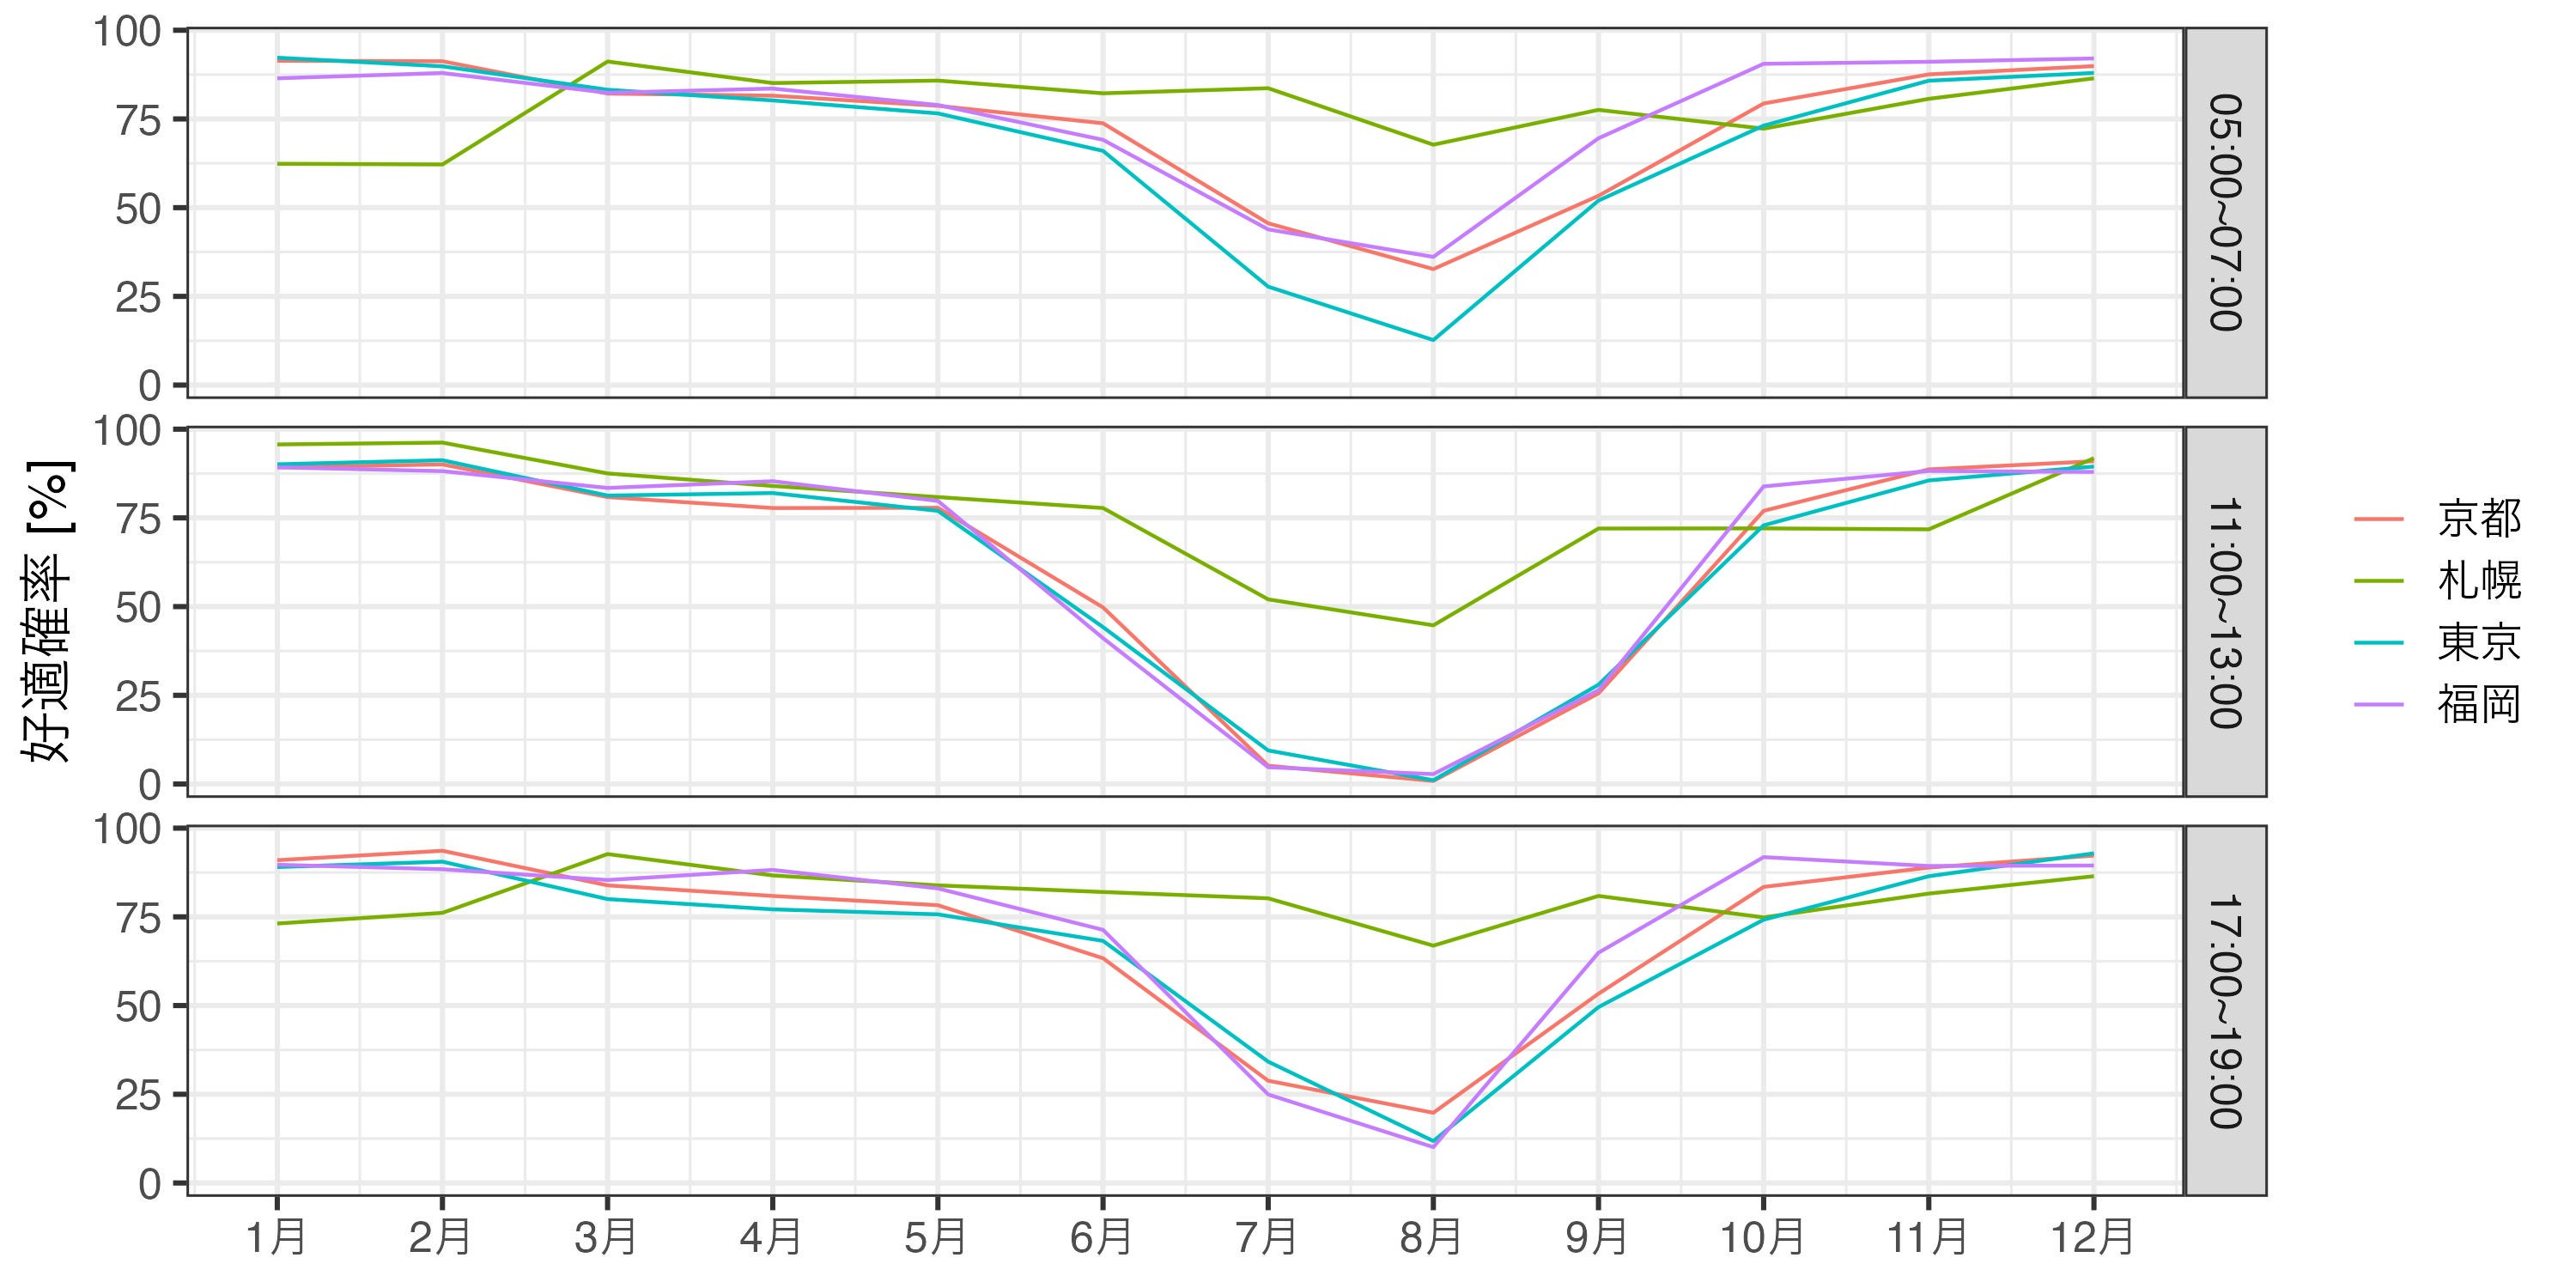
5年分のデータから散歩好適確率の月別推移をよく散歩する時間帯別にプロットしました。気温が-10 °Cを下回る厳寒期以外は札幌一強です。
compare_jpn |>
  dplyr::mutate(year = lubridate::year(date), month = lubridate::month(date),
                timezone = dplyr::case_when(hour %in% 5:7 ~ "05:00~07:00",
                                            hour %in% 11:13 ~ "11:00~13:00",
                                            hour %in% 17:19 ~ "17:00~19:00")) |>
  na.omit() |>
  dplyr::summarise(pass = mean(pass_all) * 100, .by = c(region, timezone, date, month, year)) |>
  dplyr::summarise(stat = mean(pass), .by = c(region, timezone, month))  |>
  ggplot(aes(month, stat, col = region)) +
  geom_line() +
  facet_grid(timezone ~ .) +
  scale_x_continuous(breaks = 1:12, labels = paste0(1:12, "月")) +
  labs(x = NULL, y = "好適確率 [%]", col = NULL)
5:00から20:00までの散歩好適率の年平均値でみても札幌推しです。
compare_jpn |>
  dplyr::filter(hour %in% 5:20) |>
  dplyr::summarise(pass = mean(pass_all) * 100, .by = c(region))
# A tibble: 4 × 2
  region  pass
  <chr>  <dbl>
1 札幌    78.7
2 東京    66.3
3 京都    68.2
4 福岡    69.6
解析 | 国別比較
世界各国の散歩好適度を比較します。全球解析は大変なので、国ごとの代表1地点でのデータを扱います。ggplot2内蔵(厳密にはmapsパッケージ内蔵)のworldデータを使います。region列が国3に対応し、島ごとに異なるgroupのポリゴンデータが収納されています。
world <- ggplot2::map_data("world")
head(world)
       long      lat group order region subregion
1 -69.89912 12.45200     1     1  Aruba      <NA>
2 -69.89571 12.42300     1     2  Aruba      <NA>
3 -69.94219 12.43853     1     3  Aruba      <NA>
4 -70.00415 12.50049     1     4  Aruba      <NA>
5 -70.06612 12.54697     1     5  Aruba      <NA>
6 -70.05088 12.59707     1     6  Aruba      <NA>
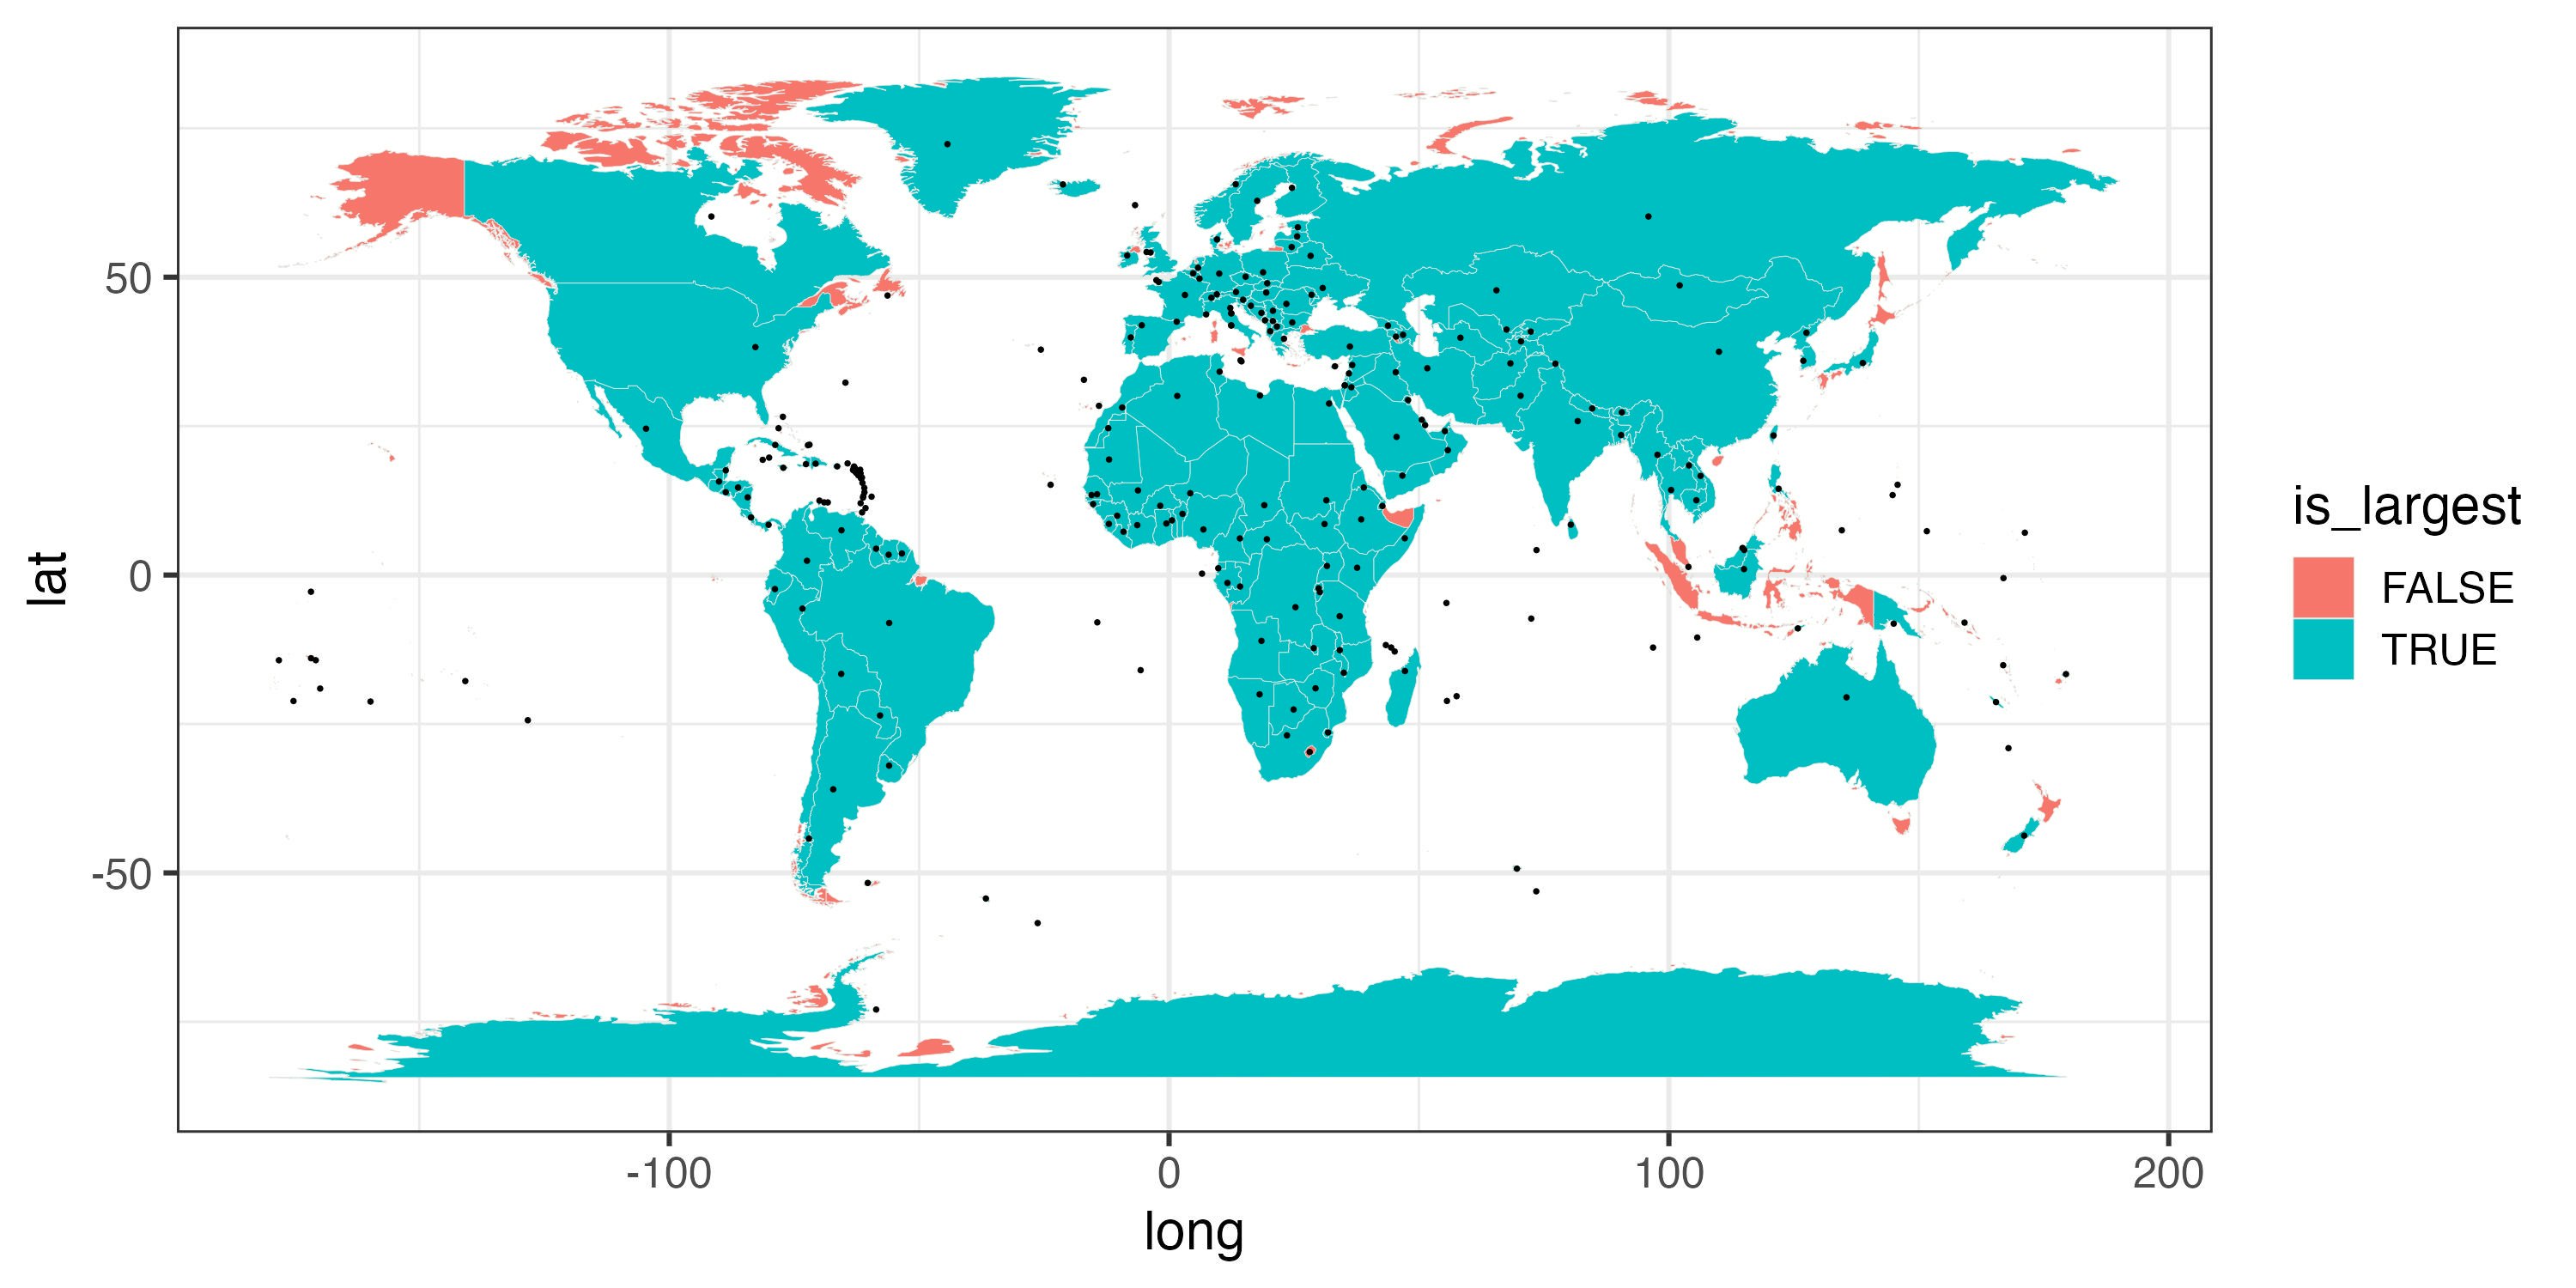
国別に頂点数が最大のポリゴンを抽出し、そのポリゴンの頂点群の緯度・経度の中央値を代表地点とみなしました4。日本だと山梨近傍で富士山周辺も含むセル、カナダだとハドソン湾内のセルが代表地点になってしまうなどしています。
largests <-
  world |>
  dplyr::mutate(num_node = dplyr::n(), .by = c(group, region)) |>
  dplyr::mutate(is_largest = num_node == max(num_node), .by = region)

centers <-
  largests |>
  dplyr::filter(is_largest) |>
  dplyr::summarise(long = median(long), lat = median(lat), .by = c(group, region))

largests |>
  ggplot(aes(long, lat)) +
  geom_polygon(aes(fill = is_largest, group = group), col = "grey90", linewidth = .1) +
  geom_point(data = centers, size = .2)
あとは先ほどと同様で、一連のパイプラインに通します。200地点について各1年分の処理で30分弱ほどかかりました。気象データ取得がボトルネックになっています。
compare_world <-
  split(centers, centers$region) |>
  purrr::map_dfr(.id = "region", function(site){
      fetch_nasapower(start = 20230101, end = 20231231, lat = site$lat[1], lon = site$long[1]) |>
        prep_nasapower() |>
        judge_sampo()
    })

arrow::write_parquet(compare_world, "compare_world.parquet")
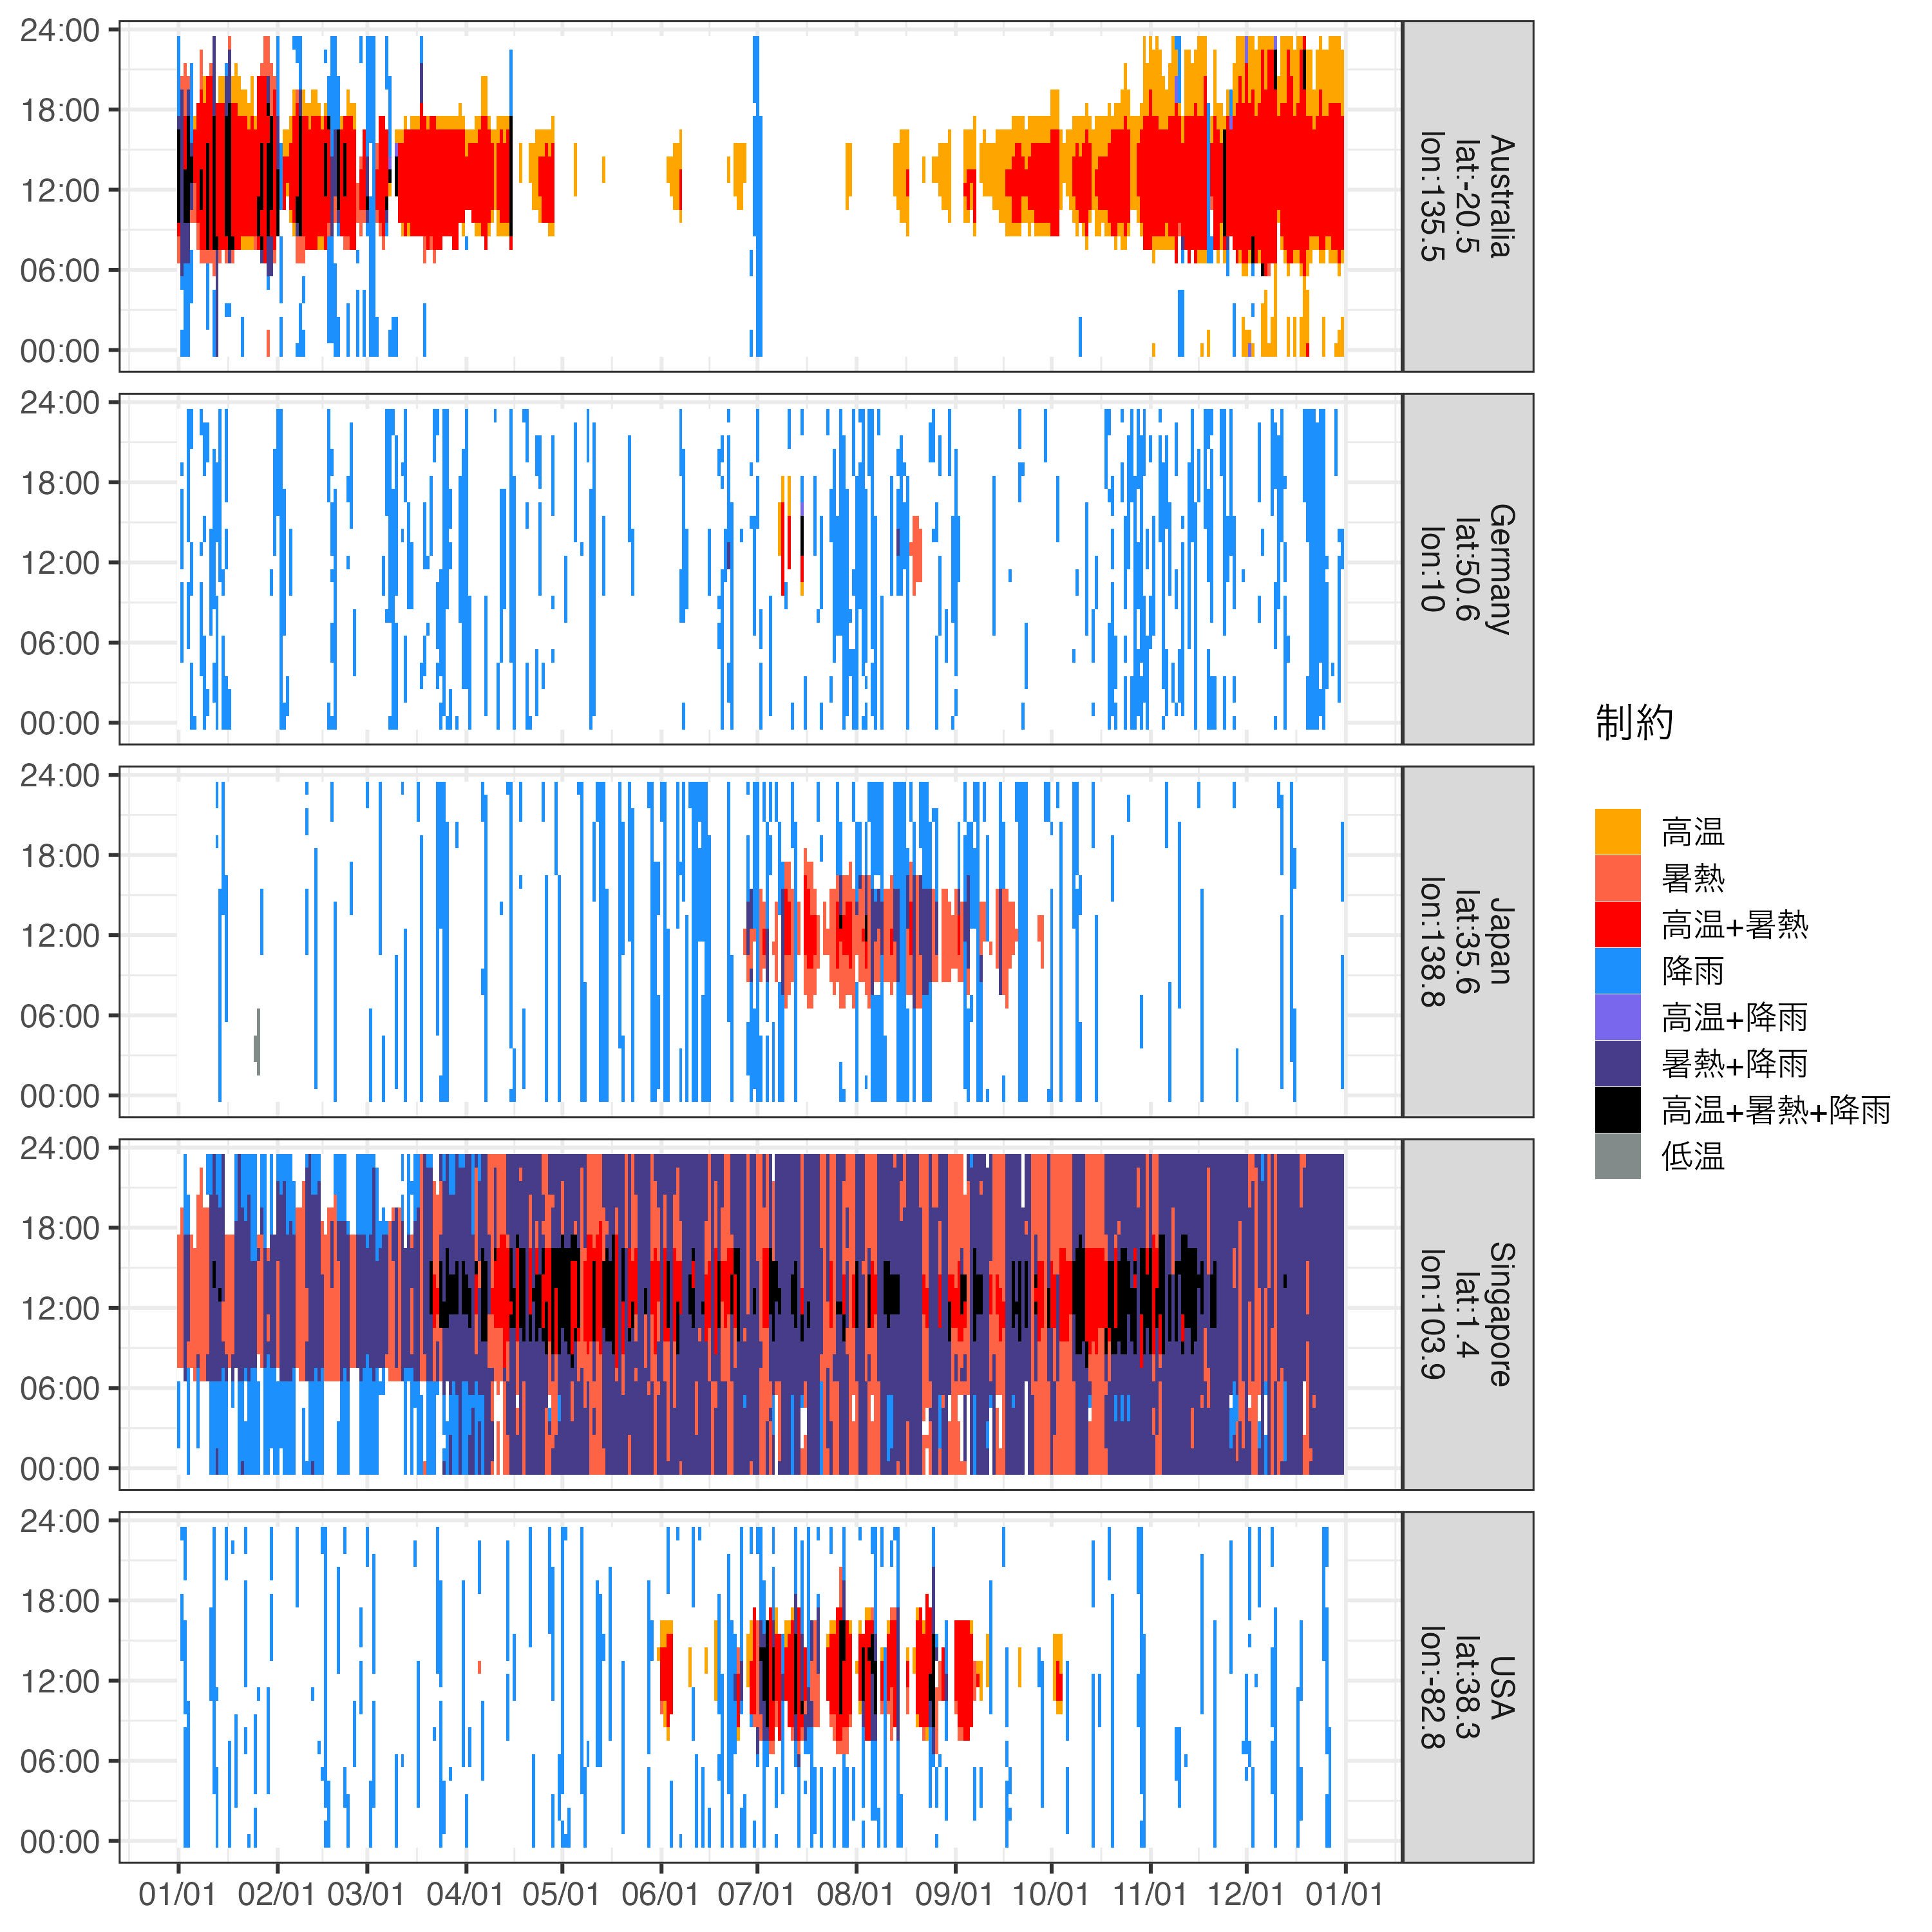
いくつかの国での好適ヒートマップを作成します。それなりに地域差を反映しているように見えます。具体的には、高温乾燥で南半球にあるオーストラリア、高温多雨な東南アジアのシンガポール、など。
compare_world <- arrow::read_parquet("compare_world.parquet")

compare_world |>
  dplyr::filter(region %in% c("Germany", "Australia", "Japan", "USA", "Singapore")) |>
  dplyr::mutate(region = paste0(region, "\nlat:", round(lat, 1), "\nlon:", round(lon, 1)),
                limitation = paste0(dplyr::if_else(pass_A, "", "A"),
                                    dplyr::if_else(pass_B, "", "B"),
                                    dplyr::if_else(pass_C, "", "C"),
                                    dplyr::if_else(pass_D, "", "D")),
                limitation = factor(limitation,
                                    levels = c("", "A", "B", "AB", "C", "AC", "BC", "ABC", "D"),
                                    labels = c("", "高温", "暑熱", "高温+暑熱", "降雨", "高温+降雨", "暑熱+降雨", "高温+暑熱+降雨", "低温")
                                    )) |>
  ggplot(aes(date, hour, fill = limitation)) +
  geom_tile() +
  facet_grid(region ~ .) +
  scale_x_date(date_breaks = "1 month", date_labels = "%m/%d") +
  scale_y_continuous(breaks = seq(0, 24, by = 6), labels = c("00:00", "06:00", "12:00", "18:00", "24:00")) +
  scale_fill_manual(values = c("white", "orange", "tomato", "red", "dodgerblue", "slateblue2", "slateblue4", "black", "azure4"),
                    limits = c("", "高温", "暑熱", "高温+暑熱", "降雨", "高温+降雨", "暑熱+降雨", "高温+暑熱+降雨", "低温")) +
  labs(x = NULL, y = NULL, fill = "制約")
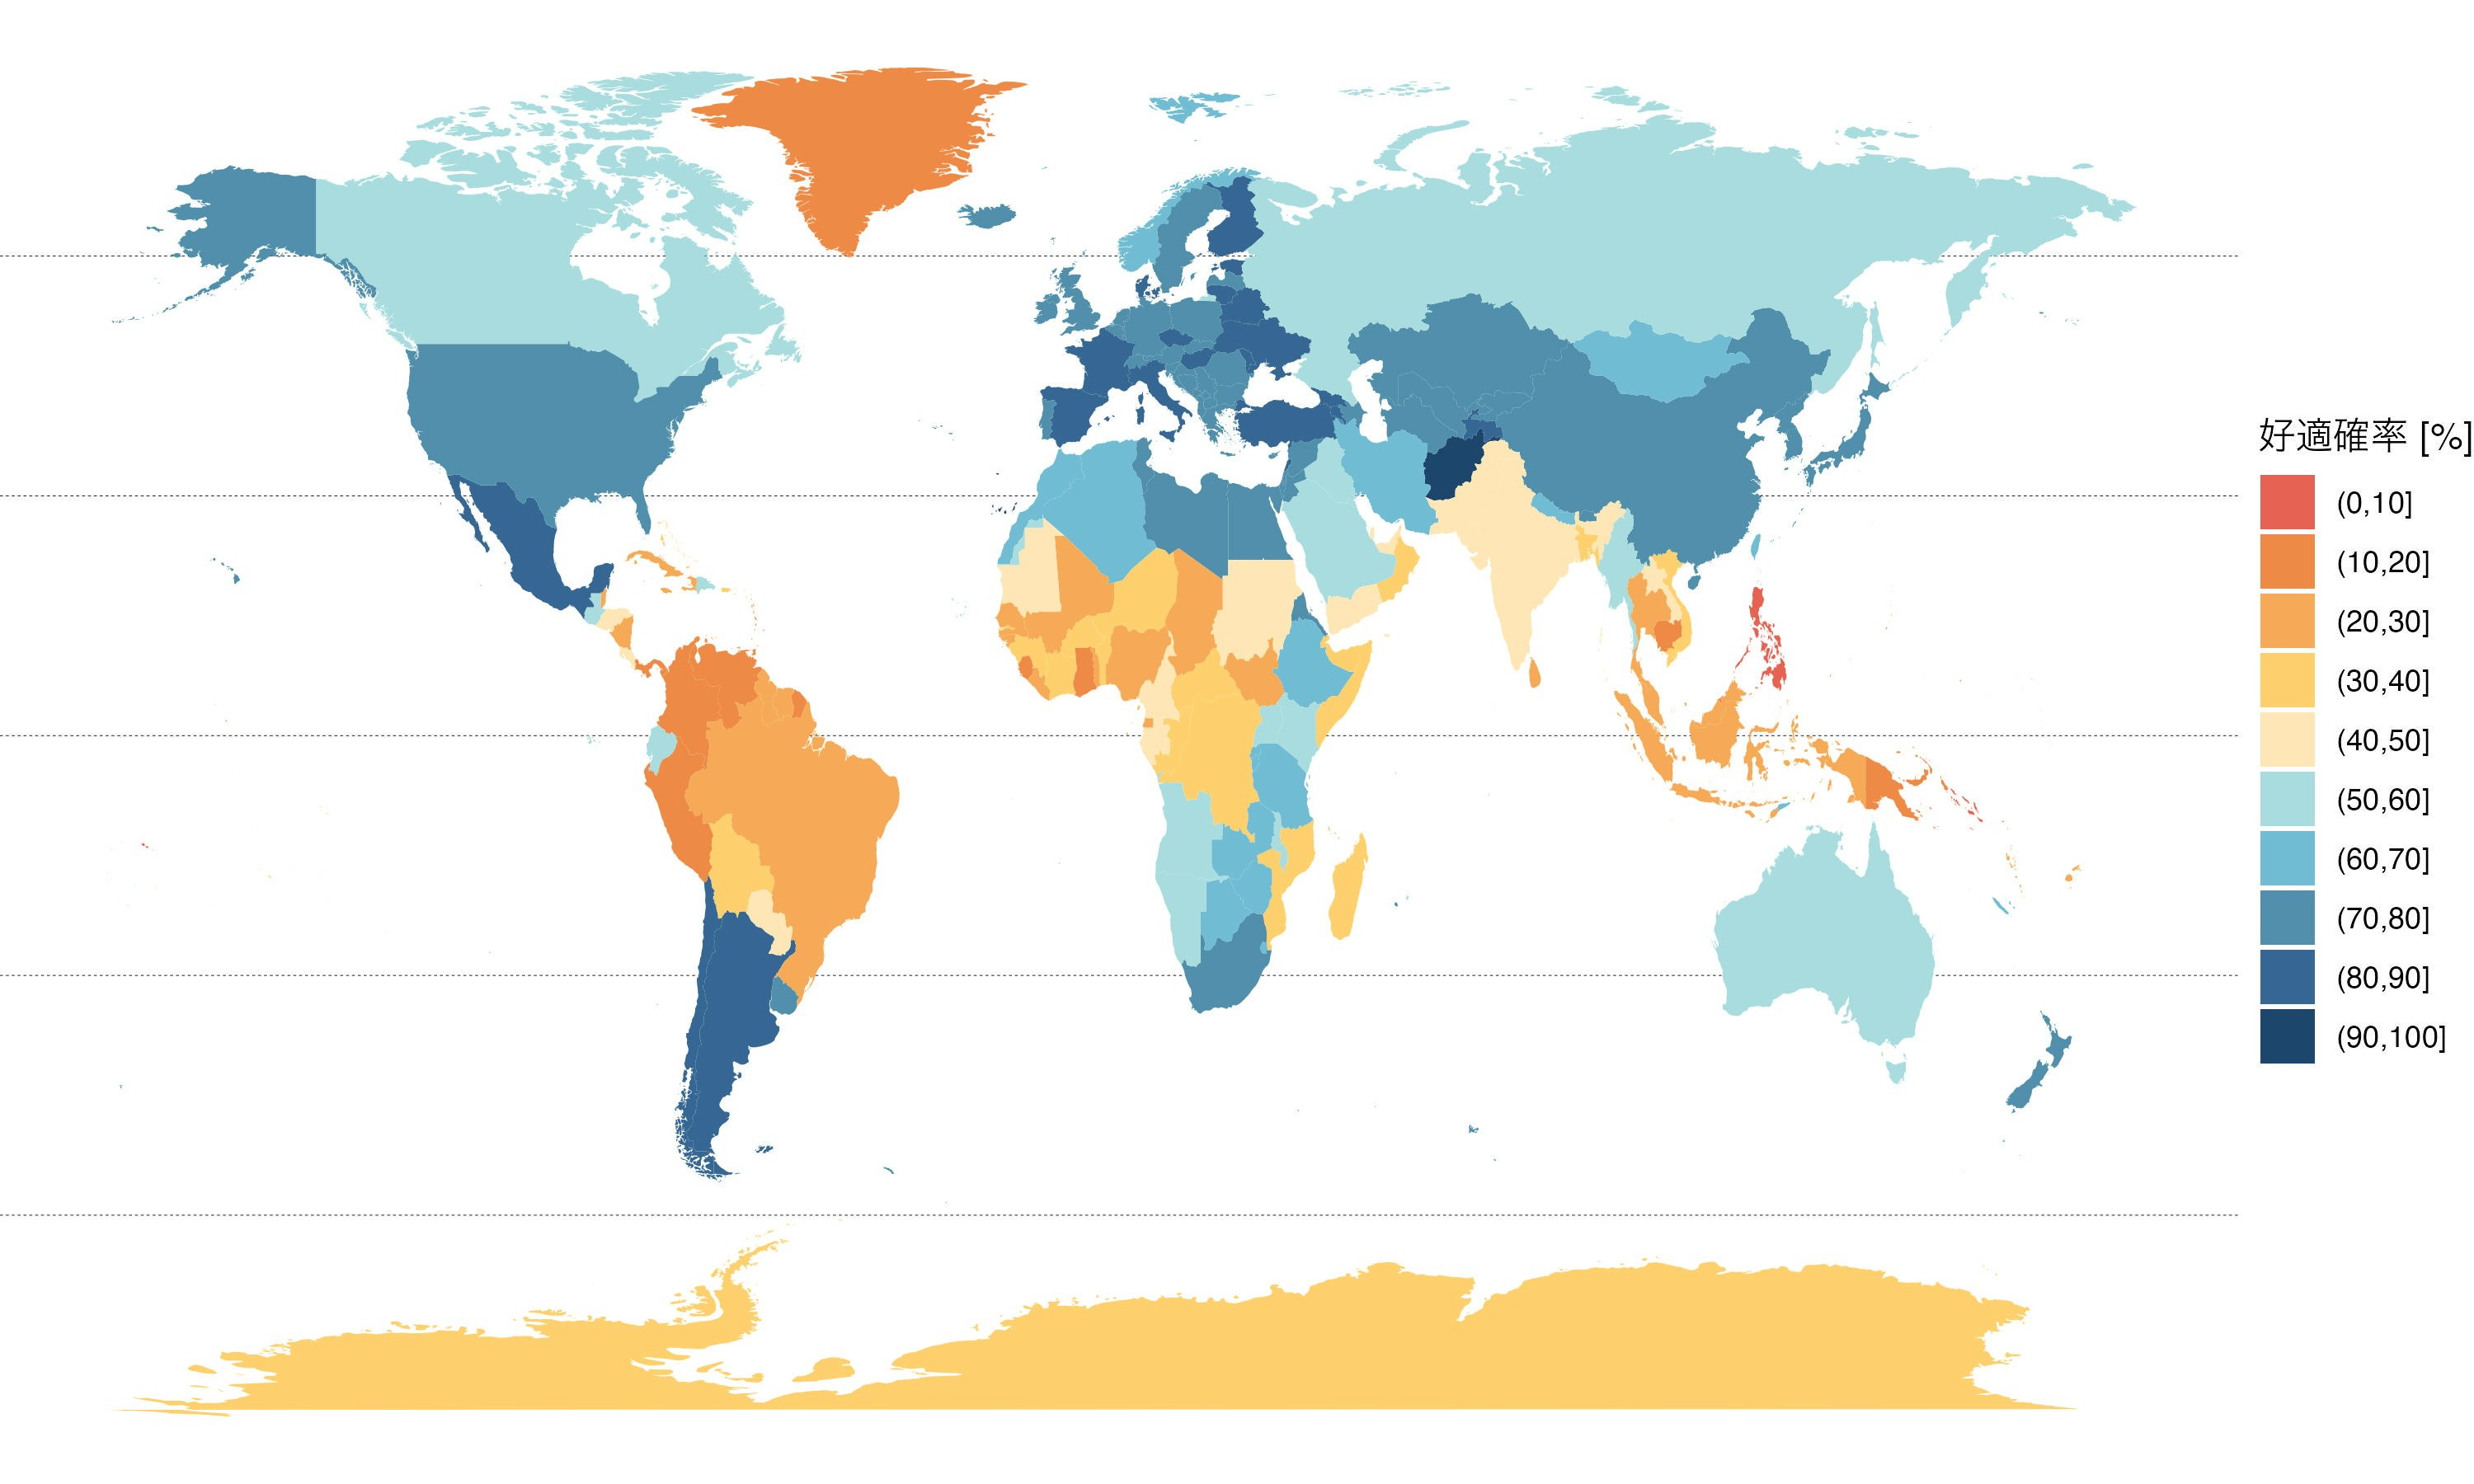
最後に5:00から20:00までの散歩好適率の年平均値を可視化したコロプレスマップを作成します。地図で見るとヨーロッパは犬と暮らしやすい国が多いということがよくわかります。色関係だとMetBrewerパッケージが好みでよく利用しています。
annual_score <-
  compare_world |>
  dplyr::filter(hour %in% 5:20) |>
  dplyr::summarise(pass = mean(pass_all) * 100, .by = c(region))

annual_score |>
  dplyr::right_join(world, by = "region") |>
  ggplot(aes(long, lat)) +
  geom_hline(yintercept = seq(-60, 60, by = 30), linetype = 2, linewidth = .1) +
  geom_polygon(aes(fill = cut(pass, seq(0, 100, by = 10)), group = group), col = NA) +
  MetBrewer::scale_fill_met_d(name = "Hiroshige") +
  theme_void() +
  labs(x = NULL, y = NULL, fill = "好適確率 [%]")
