最近R界隈で話題なのがtidyplots。
基本的にはggplot2のラッパーなのだけど、素のggplot2よりもシンプルで書きやすいという噂です。
学生さん向けの解説記事や、yutaniさんによるレビュー動画も出ています。
ここでは公式サイトのusageに載っている事例からいくつかをggplot2とtidyplotsとで書き比べてみたいと思います。
なお、デフォルト状態での表現を確認するため、両者を似せるための調整はしません。
まず必要なパッケージを読み込みます。
library(conflicted)
library(tidyverse)
library(tidyplots)
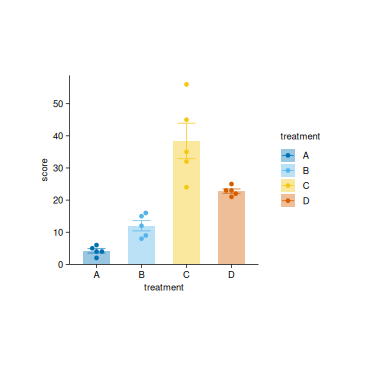
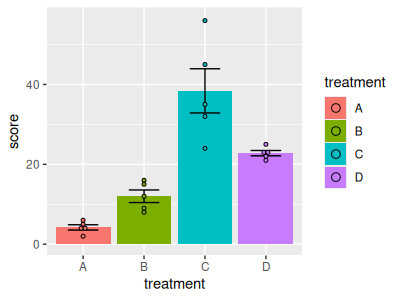
1つ目は平均の棒グラフにエラーバーとドットを載せた図です。
study %>%
  tidyplot(x = treatment, y = score, color = treatment) %>%
  add_mean_bar(alpha = 0.4) %>%
  add_sem_errorbar() %>%
  add_data_points_beeswarm()
study |>
  ggplot(aes(x = treatment, y = score, fill = treatment)) +
  stat_summary(geom = "bar", fun = "mean") +
  stat_summary(geom = "errorbar", fun.data = "mean_se", width = 0.5) +
  geom_dotplot(binaxis = "y", stackdir = "center", binwidth = 1)
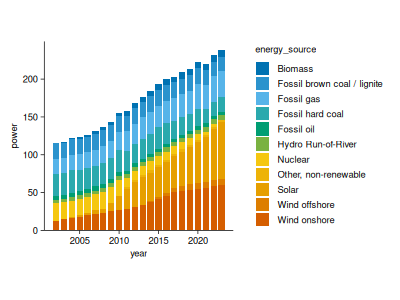
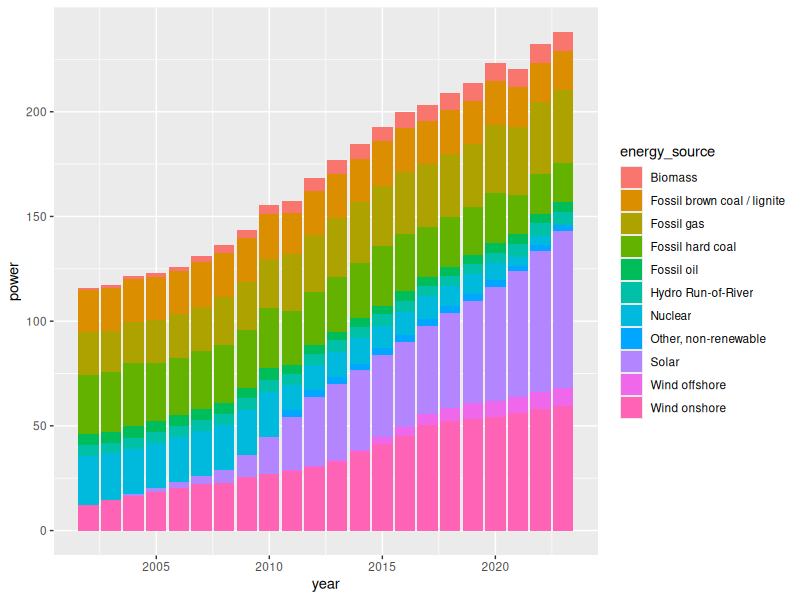
2つ目は積み上げ棒グラフ
energy %>%
  tidyplot(x = year, y = power, color = energy_source) %>%
  add_barstack_absolute()
energy %>%
  ggplot(aes(x = year, y = power, fill = energy_source )) +
  geom_col()
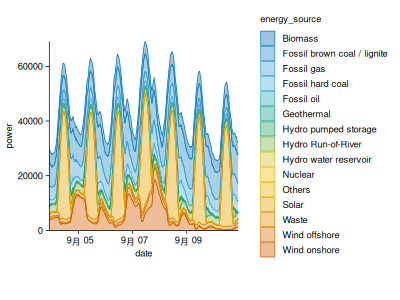
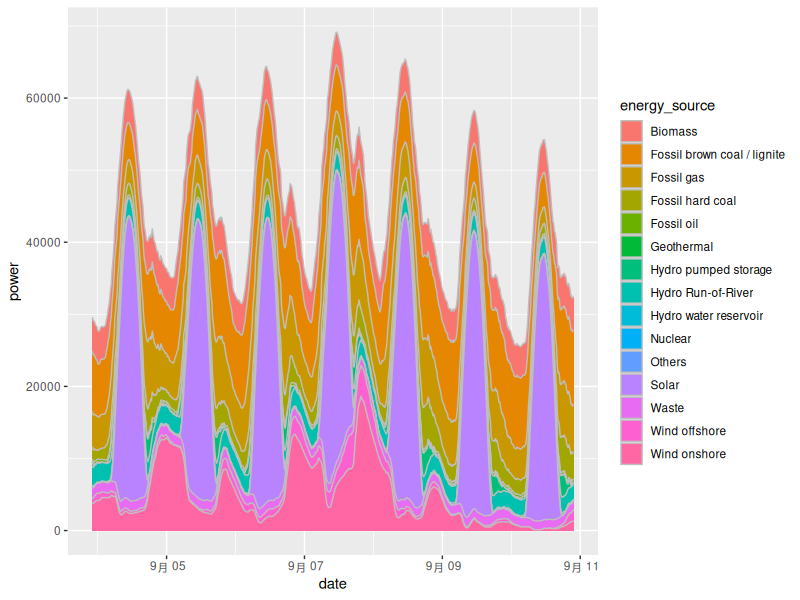
3つ目は積み上げ帯グラフ。
energy_week %>%
  tidyplot(x = date, y = power, color = energy_source) %>%
  add_areastack_absolute()
energy_week %>%
  ggplot(aes(x = date, y = power, fill = energy_source)) +
  geom_area(color = "gray")
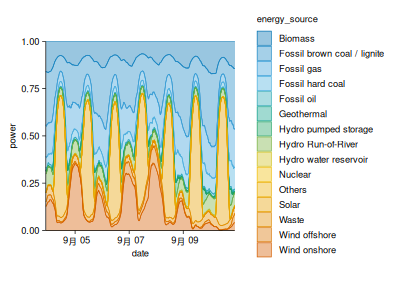
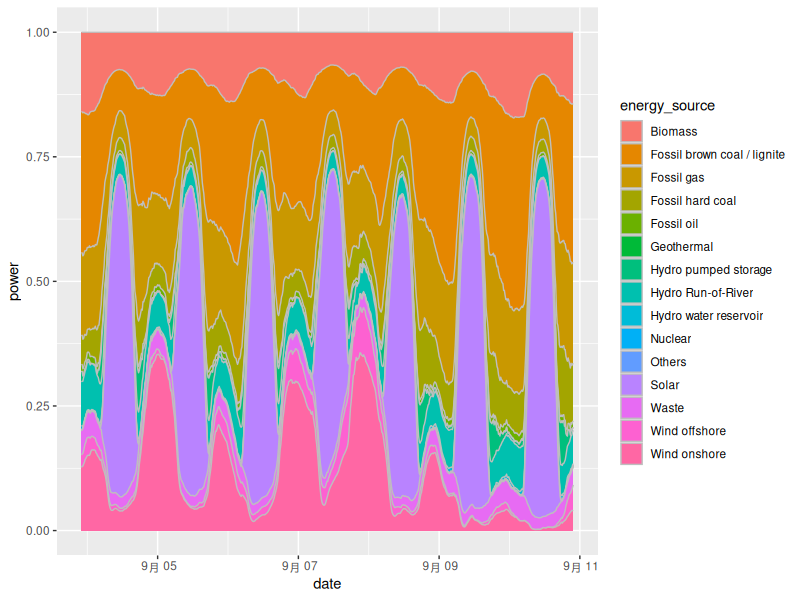
4つ目は割合を示した積み上げ棒グラフ。
energy_week %>%
  tidyplot(x = date, y = power, color = energy_source) %>%
  add_areastack_relative()
energy_week %>%
  ggplot(aes(x = date, y = power, fill = energy_source)) +
  geom_area(position = "fill", color = "gray")
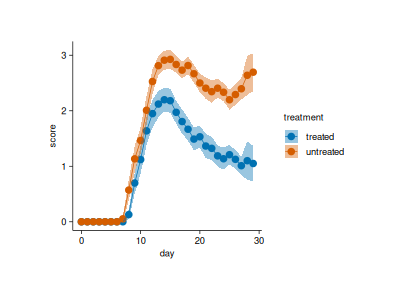
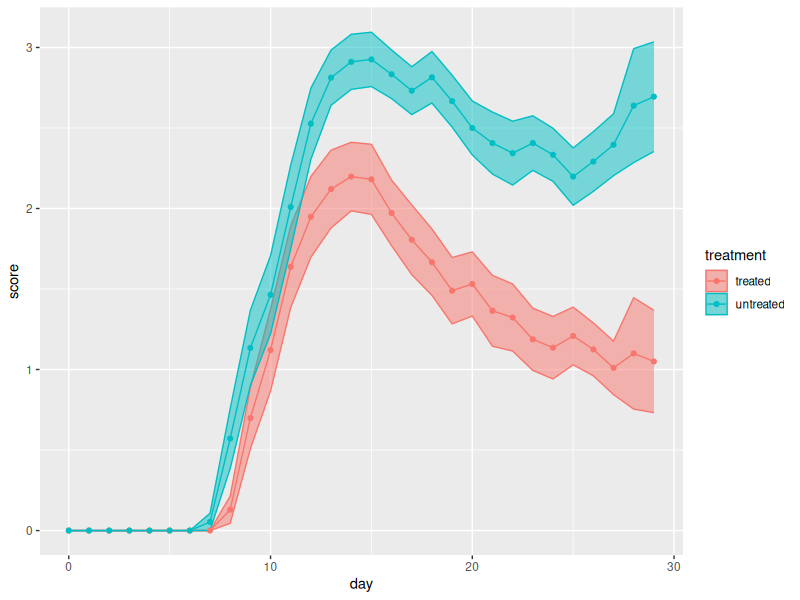
5つ目は折れ線グラフ
time_course %>%
  tidyplot(x = day, y = score, color = treatment, dodge_width = 0) %>%
  add_mean_line() %>%
  add_mean_dot() %>%
  add_sem_ribbon()
time_course %>%
  ggplot(aes(x = day, y = score, color = treatment,fill = treatment, group = treatment)) +
  stat_summary(geom = "line", fun = "mean") +
  stat_summary(geom = "ribbon", fun.data = "mean_se", alpha = 0.5) +
  stat_summary(geom = "point", fun = "mean")
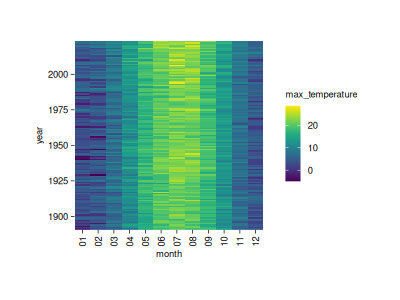
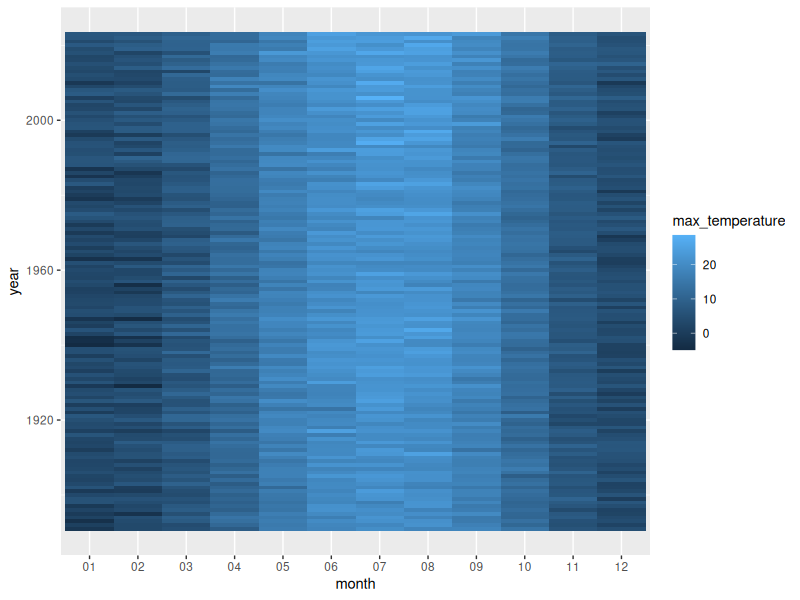
6つ目はヒートマップ。
climate %>%
  tidyplot(x = month, y = year, color = max_temperature) %>%
  add_heatmap()
climate |>
  ggplot(aes(x = month, y = year, fill = max_temperature)) +
  geom_tile()
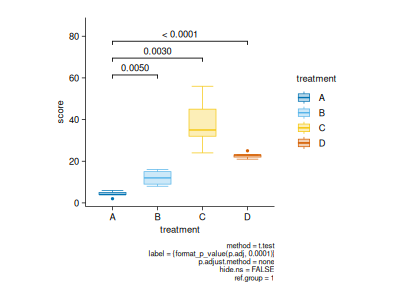
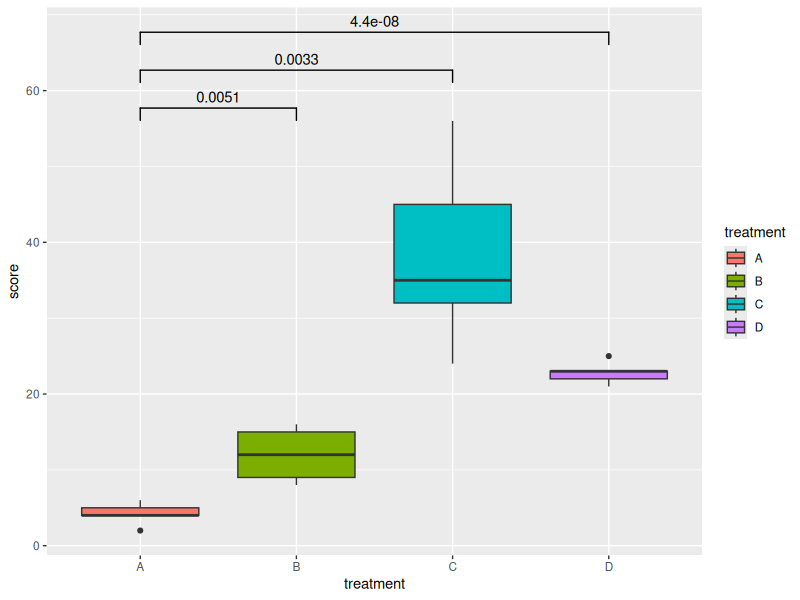
7つ目は箱ひげ図とp値。
study %>%
  tidyplot(x = treatment, y = score, color = treatment) %>%
  add_boxplot() %>%
  add_test_pvalue(ref.group = 1)
library(ggsignif)
study %>%
  ggplot(aes(x = treatment, y = score, fill =treatment)) +
  geom_boxplot() +
  geom_signif(comparisons = list(c("A", "B")), test = "t.test", map_signif_level = FALSE, y_position = 55) +
  geom_signif(comparisons = list(c("A", "C")), test = "t.test", map_signif_level = FALSE, y_position = 60) +
  geom_signif(comparisons = list(c("A", "D")), test = "t.test", map_signif_level = FALSE, y_position = 65)
はい、どうでしょうかね。
tidyplotsの方が特別短く書けるわけじゃないようです。
しかし、コードを短くすることはtidyplotsの目的ではないんでしょう。
それよりも、生のデータから細かい調整なしに見やすく整ったグラフを出してくれるのは大きなメリットだと思いました。
カラーパレットが視覚多様性に配慮されているのも嬉しいところです。
tidyplotsはggplot2から置き換えられるようなものではないですが、用途によってはggplotsで試行錯誤するよりも、tidyplotsのデフォルトの方が効率的ということもあるかもしれません。
Enjoy!
