Rによる機械学習
(ソフトウェア品質技術者のための)データ分析勉強会で、書籍『Rによる機械学習 (Machine Learning with R)』を使用して機械学習を学ぶ。
https://www.amazon.co.jp/dp/4798145114/
第8章 パターンの検出 - 相関ルールを使った買い物かご分析
用語
- 支持度(support)
- 確信度(confidence)
※確信度は、信頼度と呼ばれることもある - リフト(lift)
- 疎行列(sparse matrix)
http://tomoshige-n.hatenablog.com/entry/2014/08/05/051019 - アプリオリアルゴリズム
- アプリオリ原則
疑問点
リフトのイメージがわかない・・・
リフトはどのくらいの値から高いと判断できるのか?
基準に対してリフトが高い低いと判断するのではなく、リフトでソートし値が高いルールを抽出するという使い方?
以下のようにリフトが説明されている記事あり。
https://www.itmedia.co.jp/im/articles/0504/18/news084.html
リフト値が低ければ、何らかの理由で、帰結部のアイテムは単独で非常に売れており、条件部のアイテムとの相関関係よりも帰結部アイテム特有の理由で購買要因が存在すると考えられる。リフト値が1より大きい場合は、有効なルールといえる。
演習
準備
> install.packages("arules")
> library(arules)
> groceries<-read.transactions("groceries.csv",sep=",")
> summary(groceries)
transactions as itemMatrix in sparse format with
 9835 rows (elements/itemsets/transactions) and
 169 columns (items) and a density of 0.02609146

most frequent items:
      whole milk other vegetables       rolls/buns             soda
            2513             1903             1809             1715
          yogurt          (Other)
            1372            34055

element (itemset/transaction) length distribution:
sizes
   1    2    3    4    5    6    7    8    9   10   11   12   13   14   15
2159 1643 1299 1005  855  645  545  438  350  246  182  117   78   77   55
  16   17   18   19   20   21   22   23   24   26   27   28   29   32
  46   29   14   14    9   11    4    6    1    1    1    1    3    1

   Min. 1st Qu.  Median    Mean 3rd Qu.    Max.
  1.000   2.000   3.000   4.409   6.000  32.000

includes extended item information - examples:
            labels
1 abrasive cleaner
2 artif. sweetener
3   baby cosmetics
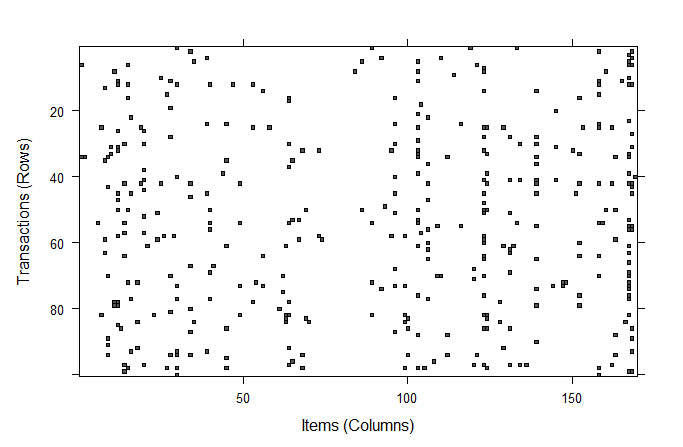
読み込んだ疎行列のイメージはimage()で可視化できる。先頭から100件(行)分のデータのイメージを表示してみる。
> image(groceries[1:100])
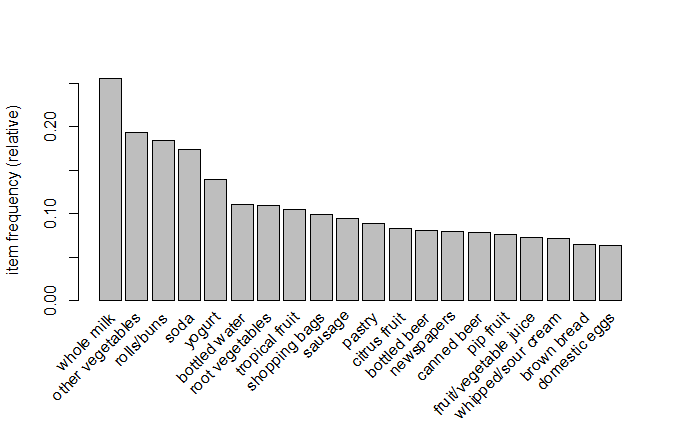
支持度0.1のデータと、登場回数上位20位のデータを表示してみる。
> itemFrequencyPlot(groceries, support=0.1)
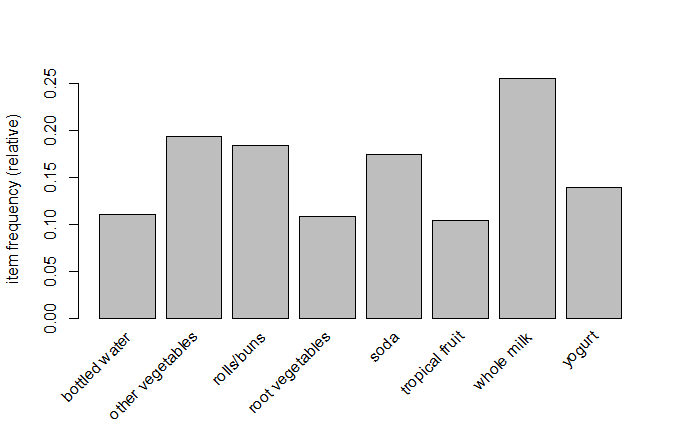
> itemFrequencyPlot(groceries, support=0.1)
モデルの訓練
appriori()を使用する。
appriori()のパラメータの説明。
- data:トランザクションデータを格納する疎行列
- support:必要とされる支持度の最小値
- confidence:必要とされる確信度の最小値
- minlen:必要とされるルールの最小値
デフォルト設定では、支持度と確信度の水準は以下になっている。
- support = 0.1
- confidence = 0.8
デフォルト設定で事項すると、水準が厳しすぎてルールが見つからない(set of 0 rules set of 0 rulesとなる)。
> apriori(groceries)
Apriori

Parameter specification:
 confidence minval smax arem  aval originalSupport maxtime support minlen
        0.8    0.1    1 none FALSE            TRUE       5     0.1      1
 maxlen target   ext
     10  rules FALSE

Algorithmic control:
 filter tree heap memopt load sort verbose
    0.1 TRUE TRUE  FALSE TRUE    2    TRUE

Absolute minimum support count: 983

set item appearances ...[0 item(s)] done [0.00s].
set transactions ...[169 item(s), 9835 transaction(s)] done [0.02s].
sorting and recoding items ... [8 item(s)] done [0.00s].
creating transaction tree ... done [0.01s].
checking subsets of size 1 2 done [0.00s].
writing ... [0 rule(s)] done [0.00s].
creating S4 object  ... done [0.01s].
set of 0 rules
支持度0.006、確信度0.25を下限としてルールを作る。1日に2回売れる(1ヵ月(30日)で60回)ことを条件とすると、支持度は約0.006となる。商品が1つしか含まれない意味のないルールを取り除くたえに、minlenを2とする。
> groceryrules <- apriori(groceries, parameter = list(support = 0.006, confidence = 0.25, minlen = 2))
Apriori

Parameter specification:
 confidence minval smax arem  aval originalSupport maxtime support minlen
       0.25    0.1    1 none FALSE            TRUE       5   0.006      2
 maxlen target   ext
     10  rules FALSE

Algorithmic control:
 filter tree heap memopt load sort verbose
    0.1 TRUE TRUE  FALSE TRUE    2    TRUE

Absolute minimum support count: 59

set item appearances ...[0 item(s)] done [0.00s].
set transactions ...[169 item(s), 9835 transaction(s)] done [0.02s].
sorting and recoding items ... [109 item(s)] done [0.00s].
creating transaction tree ... done [0.02s].
checking subsets of size 1 2 3 4 done [0.02s].
writing ... [463 rule(s)] done [0.01s].
creating S4 object  ... done [0.01s].
ルールの概要を確認する。
2アイテムのルールが150、3アイテムのルールが297、4アイテムのルールが16ある。
> groceryrules
set of 463 rules
> summary(groceryrules)
set of 463 rules

rule length distribution (lhs + rhs):sizes
  2   3   4
150 297  16

   Min. 1st Qu.  Median    Mean 3rd Qu.    Max.
  2.000   2.000   3.000   2.711   3.000   4.000

summary of quality measures:
    support           confidence          lift            count
 Min.   :0.006101   Min.   :0.2500   Min.   :0.9932   Min.   : 60.0
 1st Qu.:0.007117   1st Qu.:0.2971   1st Qu.:1.6229   1st Qu.: 70.0
 Median :0.008744   Median :0.3554   Median :1.9332   Median : 86.0
 Mean   :0.011539   Mean   :0.3786   Mean   :2.0351   Mean   :113.5
 3rd Qu.:0.012303   3rd Qu.:0.4495   3rd Qu.:2.3565   3rd Qu.:121.0
 Max.   :0.074835   Max.   :0.6600   Max.   :3.9565   Max.   :736.0

mining info:
      data ntransactions support confidence
 groceries          9835   0.006       0.25
ルールの内容を見てみる。最初から10個のルールを見てみる。
> inspect(groceryrules[1:10])
     lhs                      rhs                support     confidence
[1]  {potted plants}       => {whole milk}       0.006914082 0.4000000
[2]  {pasta}               => {whole milk}       0.006100661 0.4054054
[3]  {herbs}               => {root vegetables}  0.007015760 0.4312500
[4]  {herbs}               => {other vegetables} 0.007727504 0.4750000
[5]  {herbs}               => {whole milk}       0.007727504 0.4750000
[6]  {processed cheese}    => {whole milk}       0.007015760 0.4233129
[7]  {semi-finished bread} => {whole milk}       0.007117438 0.4022989
[8]  {beverages}           => {whole milk}       0.006812405 0.2617188
[9]  {detergent}           => {other vegetables} 0.006405694 0.3333333
[10] {detergent}           => {whole milk}       0.008947636 0.4656085
モデルの評価
ルールをリフトが高い順に並び替え、上位10件のルールを抽出する。
> groceryrules_sort <- sort(groceryrules, by = "lift")
> inspect(groceryrules_sort[1:10])
     lhs                   rhs                      support confidence     lift count
[1]  {herbs}            => {root vegetables}    0.007015760  0.4312500 3.956477    69
[2]  {berries}          => {whipped/sour cream} 0.009049314  0.2721713 3.796886    89
[3]  {other vegetables,
      tropical fruit,
      whole milk}       => {root vegetables}    0.007015760  0.4107143 3.768074    69
[4]  {beef,
      other vegetables} => {root vegetables}    0.007930859  0.4020619 3.688692    78
[5]  {other vegetables,
      tropical fruit}   => {pip fruit}          0.009456024  0.2634561 3.482649    93
[6]  {beef,
      whole milk}       => {root vegetables}    0.008032537  0.3779904 3.467851    79
[7]  {other vegetables,
      pip fruit}        => {tropical fruit}     0.009456024  0.3618677 3.448613    93
[8]  {pip fruit,
      yogurt}           => {tropical fruit}     0.006405694  0.3559322 3.392048    63
[9]  {citrus fruit,
      other vegetables} => {root vegetables}    0.010371124  0.3591549 3.295045   102
[10] {other vegetables,
      whole milk,
      yogurt}           => {tropical fruit}     0.007625826  0.3424658 3.263712    75
ベリー類がほかのどの商品と一緒によく購入されているかを調べる。
> berryrules <- subset(groceryrules, items %in% "berries")
> inspect(berryrules)
    lhs          rhs                  support     confidence lift     count
[1] {berries} => {whipped/sour cream} 0.009049314 0.2721713  3.796886  89
[2] {berries} => {yogurt}             0.010574479 0.3180428  2.279848 104
[3] {berries} => {other vegetables}   0.010269446 0.3088685  1.596280 101
[4] {berries} => {whole milk}         0.011794611 0.3547401  1.388328 116
ルールの保存
ファイルとデータフレームにルールを保存する。
> write(groceryrules, file = "groceryrules.csv", sep = ",", quote = TRUE, row.names = FALSE)
> groceryrules_df <- as(groceryrules, "data.frame")
> str(groceryrules_df)
'data.frame':	463 obs. of  5 variables:
 $ rules     : Factor w/ 463 levels "{baking powder} => {other vegetables}",..: 340 302 207 206 208 341 402 21 139 140 ...
 $ support   : num  0.00691 0.0061 0.00702 0.00773 0.00773 ...
 $ confidence: num  0.4 0.405 0.431 0.475 0.475 ...
 $ lift      : num  1.57 1.59 3.96 2.45 1.86 ...
 $ count     : int  68 60 69 76 76 69 70 67 63 88 ...
Rのおまけ
パラメータは綴り間違いがあっても動く
以下のようにパラメータの綴りを間違えていても、Rは処理を実行する。
この場合は、support=0としてすべてのデータが表示されてしまう。
> itemFrequencyPlot(groceries, supprot=0.1)
summary(),str(),plot()でとりあえずデータを見てみる
- オブジェクトの内容を簡潔に整形して表示 str() 関数
- サマリー機能 summary() 多くの R の統計処理関数の結果は summary() 関数で結果の簡潔かつ本質的な要約を得ることが出来る。「もしや」と一度試してみる価値がある。
- プロット機能 plot() 多くの R の統計処理関数の結果は plot() 関数でグラフィックス表示を得ることが出来る。「もしや」と一度試してみる価値がある。